Shoshone vs Icelander Divorced or Separated
COMPARE
Shoshone
Icelander
Divorced or Separated
Divorced or Separated Comparison
Shoshone
Icelanders
14.0%
DIVORCED OR SEPARATED
0.0/ 100
METRIC RATING
336th/ 347
METRIC RANK
12.0%
DIVORCED OR SEPARATED
66.0/ 100
METRIC RATING
158th/ 347
METRIC RANK
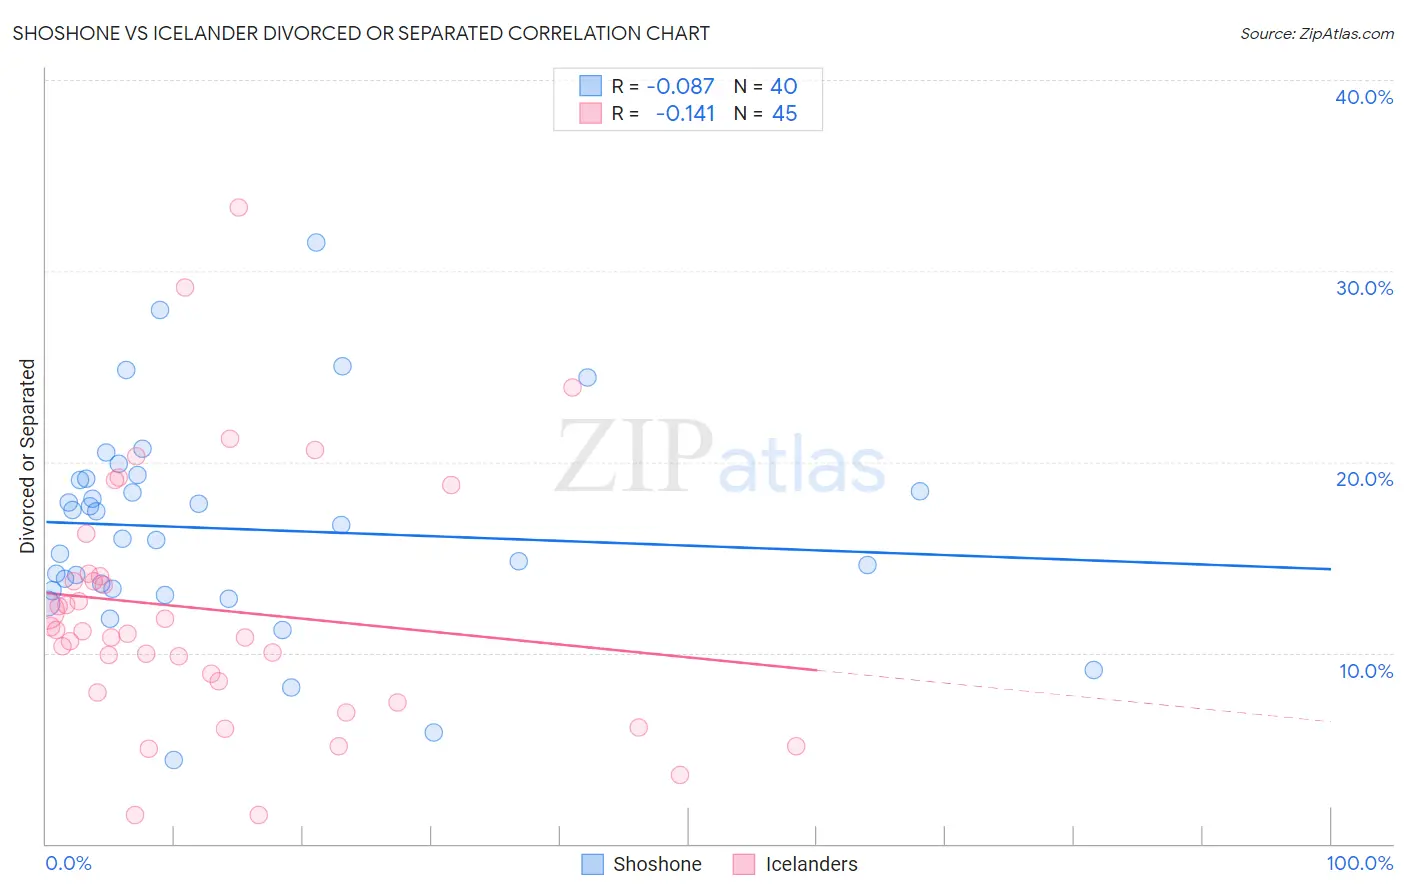
Shoshone vs Icelander Divorced or Separated Correlation Chart
The statistical analysis conducted on geographies consisting of 66,626,877 people shows a slight negative correlation between the proportion of Shoshone and percentage of population currently divorced or separated in the United States with a correlation coefficient (R) of -0.087 and weighted average of 14.0%. Similarly, the statistical analysis conducted on geographies consisting of 159,640,035 people shows a poor negative correlation between the proportion of Icelanders and percentage of population currently divorced or separated in the United States with a correlation coefficient (R) of -0.141 and weighted average of 12.0%, a difference of 17.1%.
Divorced or Separated Correlation Summary
| Measurement | Shoshone | Icelander |
| Minimum | 4.4% | 1.5% |
| Maximum | 31.5% | 33.3% |
| Range | 27.1% | 31.8% |
| Mean | 16.5% | 12.3% |
| Median | 16.4% | 11.1% |
| Interquartile 25% (IQ1) | 13.3% | 8.2% |
| Interquartile 75% (IQ3) | 19.1% | 14.1% |
| Interquartile Range (IQR) | 5.7% | 5.9% |
| Standard Deviation (Sample) | 5.5% | 6.6% |
| Standard Deviation (Population) | 5.4% | 6.5% |
Similar Demographics by Divorced or Separated
Demographics Similar to Shoshone by Divorced or Separated
In terms of divorced or separated, the demographic groups most similar to Shoshone are Crow (14.1%, a difference of 0.28%), Dutch West Indian (14.0%, a difference of 0.34%), Choctaw (14.1%, a difference of 0.60%), Immigrants from Bahamas (13.9%, a difference of 0.95%), and Colville (14.2%, a difference of 1.1%).
| Demographics | Rating | Rank | Divorced or Separated |
| Houma | 0.0 /100 | #329 | Tragic 13.6% |
| Paiute | 0.0 /100 | #330 | Tragic 13.6% |
| Blacks/African Americans | 0.0 /100 | #331 | Tragic 13.6% |
| Cherokee | 0.0 /100 | #332 | Tragic 13.7% |
| Puerto Ricans | 0.0 /100 | #333 | Tragic 13.9% |
| Immigrants | Bahamas | 0.0 /100 | #334 | Tragic 13.9% |
| Dutch West Indians | 0.0 /100 | #335 | Tragic 14.0% |
| Shoshone | 0.0 /100 | #336 | Tragic 14.0% |
| Crow | 0.0 /100 | #337 | Tragic 14.1% |
| Choctaw | 0.0 /100 | #338 | Tragic 14.1% |
| Colville | 0.0 /100 | #339 | Tragic 14.2% |
| Chickasaw | 0.0 /100 | #340 | Tragic 14.2% |
| Bahamians | 0.0 /100 | #341 | Tragic 14.2% |
| Seminole | 0.0 /100 | #342 | Tragic 14.3% |
| Creek | 0.0 /100 | #343 | Tragic 14.4% |
Demographics Similar to Icelanders by Divorced or Separated
In terms of divorced or separated, the demographic groups most similar to Icelanders are Immigrants from Barbados (12.0%, a difference of 0.0%), Immigrants from Scotland (12.0%, a difference of 0.010%), Marshallese (12.0%, a difference of 0.060%), Samoan (12.0%, a difference of 0.070%), and Navajo (12.0%, a difference of 0.080%).
| Demographics | Rating | Rank | Divorced or Separated |
| Czechs | 76.4 /100 | #151 | Good 11.9% |
| Immigrants | Hungary | 73.7 /100 | #152 | Good 11.9% |
| Austrians | 72.2 /100 | #153 | Good 12.0% |
| Chileans | 71.3 /100 | #154 | Good 12.0% |
| Japanese | 70.9 /100 | #155 | Good 12.0% |
| Hungarians | 70.3 /100 | #156 | Good 12.0% |
| Immigrants | Brazil | 68.8 /100 | #157 | Good 12.0% |
| Icelanders | 66.0 /100 | #158 | Good 12.0% |
| Immigrants | Barbados | 66.0 /100 | #159 | Good 12.0% |
| Immigrants | Scotland | 65.8 /100 | #160 | Good 12.0% |
| Marshallese | 64.6 /100 | #161 | Good 12.0% |
| Samoans | 64.3 /100 | #162 | Good 12.0% |
| Navajo | 63.9 /100 | #163 | Good 12.0% |
| Swiss | 63.6 /100 | #164 | Good 12.0% |
| German Russians | 61.8 /100 | #165 | Good 12.0% |