Immigrants from Sri Lanka vs Icelander Divorced or Separated
COMPARE
Immigrants from Sri Lanka
Icelander
Divorced or Separated
Divorced or Separated Comparison
Immigrants from Sri Lanka
Icelanders
10.8%
DIVORCED OR SEPARATED
100.0/ 100
METRIC RATING
24th/ 347
METRIC RANK
12.0%
DIVORCED OR SEPARATED
66.0/ 100
METRIC RATING
158th/ 347
METRIC RANK
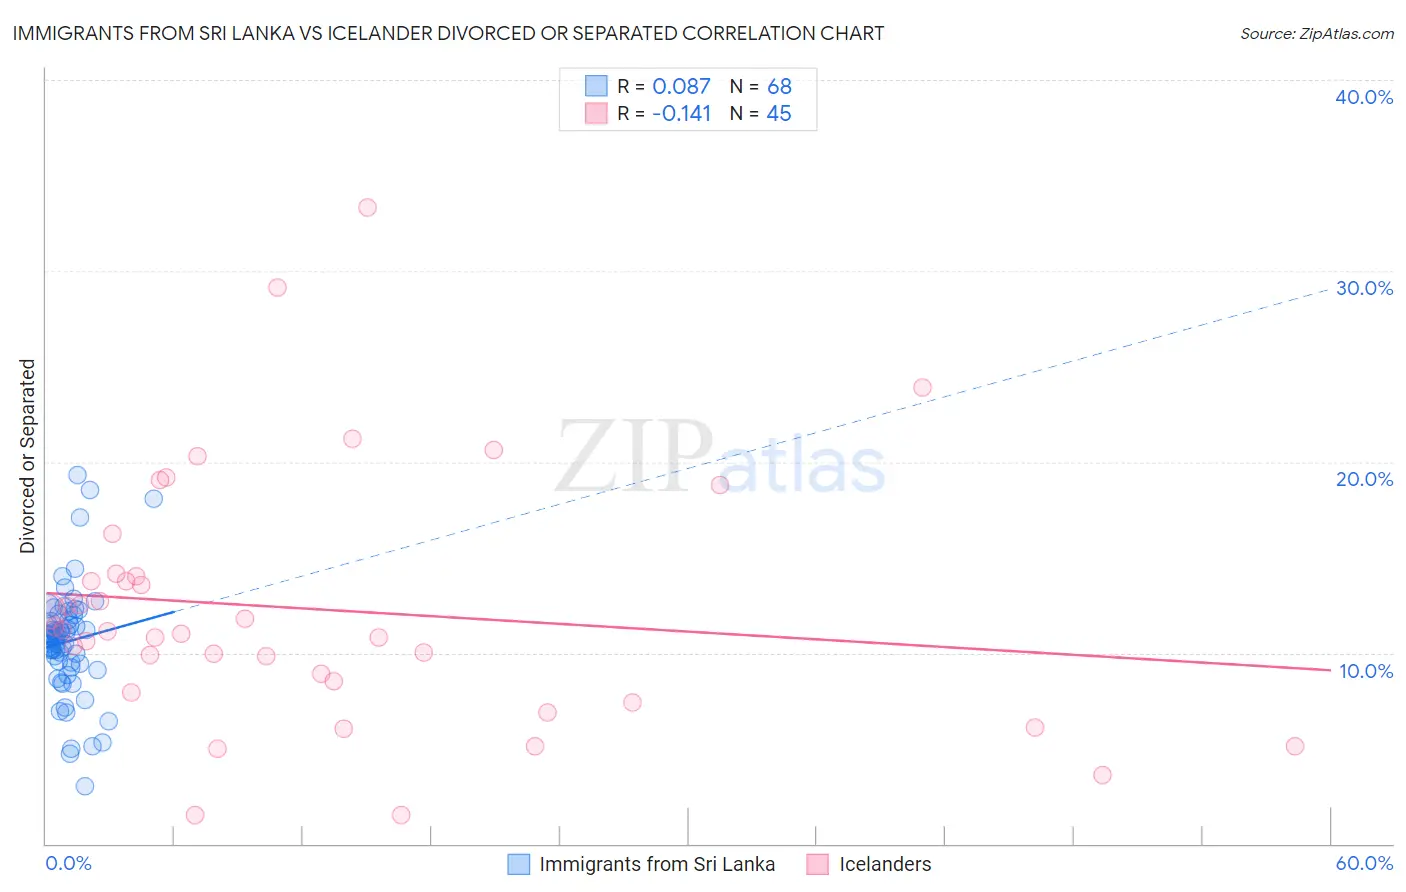
Immigrants from Sri Lanka vs Icelander Divorced or Separated Correlation Chart
The statistical analysis conducted on geographies consisting of 149,682,065 people shows a slight positive correlation between the proportion of Immigrants from Sri Lanka and percentage of population currently divorced or separated in the United States with a correlation coefficient (R) of 0.087 and weighted average of 10.8%. Similarly, the statistical analysis conducted on geographies consisting of 159,640,035 people shows a poor negative correlation between the proportion of Icelanders and percentage of population currently divorced or separated in the United States with a correlation coefficient (R) of -0.141 and weighted average of 12.0%, a difference of 11.0%.
Divorced or Separated Correlation Summary
| Measurement | Immigrants from Sri Lanka | Icelander |
| Minimum | 3.0% | 1.5% |
| Maximum | 19.3% | 33.3% |
| Range | 16.3% | 31.8% |
| Mean | 10.6% | 12.3% |
| Median | 10.8% | 11.1% |
| Interquartile 25% (IQ1) | 9.3% | 8.2% |
| Interquartile 75% (IQ3) | 11.8% | 14.1% |
| Interquartile Range (IQR) | 2.5% | 5.9% |
| Standard Deviation (Sample) | 3.0% | 6.6% |
| Standard Deviation (Population) | 2.9% | 6.5% |
Similar Demographics by Divorced or Separated
Demographics Similar to Immigrants from Sri Lanka by Divorced or Separated
In terms of divorced or separated, the demographic groups most similar to Immigrants from Sri Lanka are Iranian (10.8%, a difference of 0.050%), Immigrants from Pakistan (10.8%, a difference of 0.19%), Vietnamese (10.8%, a difference of 0.37%), Immigrants from Asia (10.7%, a difference of 0.63%), and Burmese (10.7%, a difference of 0.81%).
| Demographics | Rating | Rank | Divorced or Separated |
| Immigrants | Israel | 100.0 /100 | #17 | Exceptional 10.6% |
| Immigrants | Iran | 100.0 /100 | #18 | Exceptional 10.6% |
| Asians | 100.0 /100 | #19 | Exceptional 10.6% |
| Burmese | 100.0 /100 | #20 | Exceptional 10.7% |
| Immigrants | Asia | 100.0 /100 | #21 | Exceptional 10.7% |
| Vietnamese | 100.0 /100 | #22 | Exceptional 10.8% |
| Immigrants | Pakistan | 100.0 /100 | #23 | Exceptional 10.8% |
| Immigrants | Sri Lanka | 100.0 /100 | #24 | Exceptional 10.8% |
| Iranians | 100.0 /100 | #25 | Exceptional 10.8% |
| Immigrants | Indonesia | 100.0 /100 | #26 | Exceptional 10.9% |
| Immigrants | Bangladesh | 100.0 /100 | #27 | Exceptional 11.0% |
| Immigrants | Malaysia | 100.0 /100 | #28 | Exceptional 11.0% |
| Armenians | 100.0 /100 | #29 | Exceptional 11.0% |
| Immigrants | Ireland | 100.0 /100 | #30 | Exceptional 11.0% |
| Mongolians | 100.0 /100 | #31 | Exceptional 11.1% |
Demographics Similar to Icelanders by Divorced or Separated
In terms of divorced or separated, the demographic groups most similar to Icelanders are Immigrants from Barbados (12.0%, a difference of 0.0%), Immigrants from Scotland (12.0%, a difference of 0.010%), Marshallese (12.0%, a difference of 0.060%), Samoan (12.0%, a difference of 0.070%), and Navajo (12.0%, a difference of 0.080%).
| Demographics | Rating | Rank | Divorced or Separated |
| Czechs | 76.4 /100 | #151 | Good 11.9% |
| Immigrants | Hungary | 73.7 /100 | #152 | Good 11.9% |
| Austrians | 72.2 /100 | #153 | Good 12.0% |
| Chileans | 71.3 /100 | #154 | Good 12.0% |
| Japanese | 70.9 /100 | #155 | Good 12.0% |
| Hungarians | 70.3 /100 | #156 | Good 12.0% |
| Immigrants | Brazil | 68.8 /100 | #157 | Good 12.0% |
| Icelanders | 66.0 /100 | #158 | Good 12.0% |
| Immigrants | Barbados | 66.0 /100 | #159 | Good 12.0% |
| Immigrants | Scotland | 65.8 /100 | #160 | Good 12.0% |
| Marshallese | 64.6 /100 | #161 | Good 12.0% |
| Samoans | 64.3 /100 | #162 | Good 12.0% |
| Navajo | 63.9 /100 | #163 | Good 12.0% |
| Swiss | 63.6 /100 | #164 | Good 12.0% |
| German Russians | 61.8 /100 | #165 | Good 12.0% |