Bermudan vs Vietnamese 7th Grade
COMPARE
Bermudan
Vietnamese
7th Grade
7th Grade Comparison
Bermudans
Vietnamese
96.1%
7TH GRADE
66.3/ 100
METRIC RATING
161st/ 347
METRIC RANK
93.9%
7TH GRADE
0.0/ 100
METRIC RATING
315th/ 347
METRIC RANK
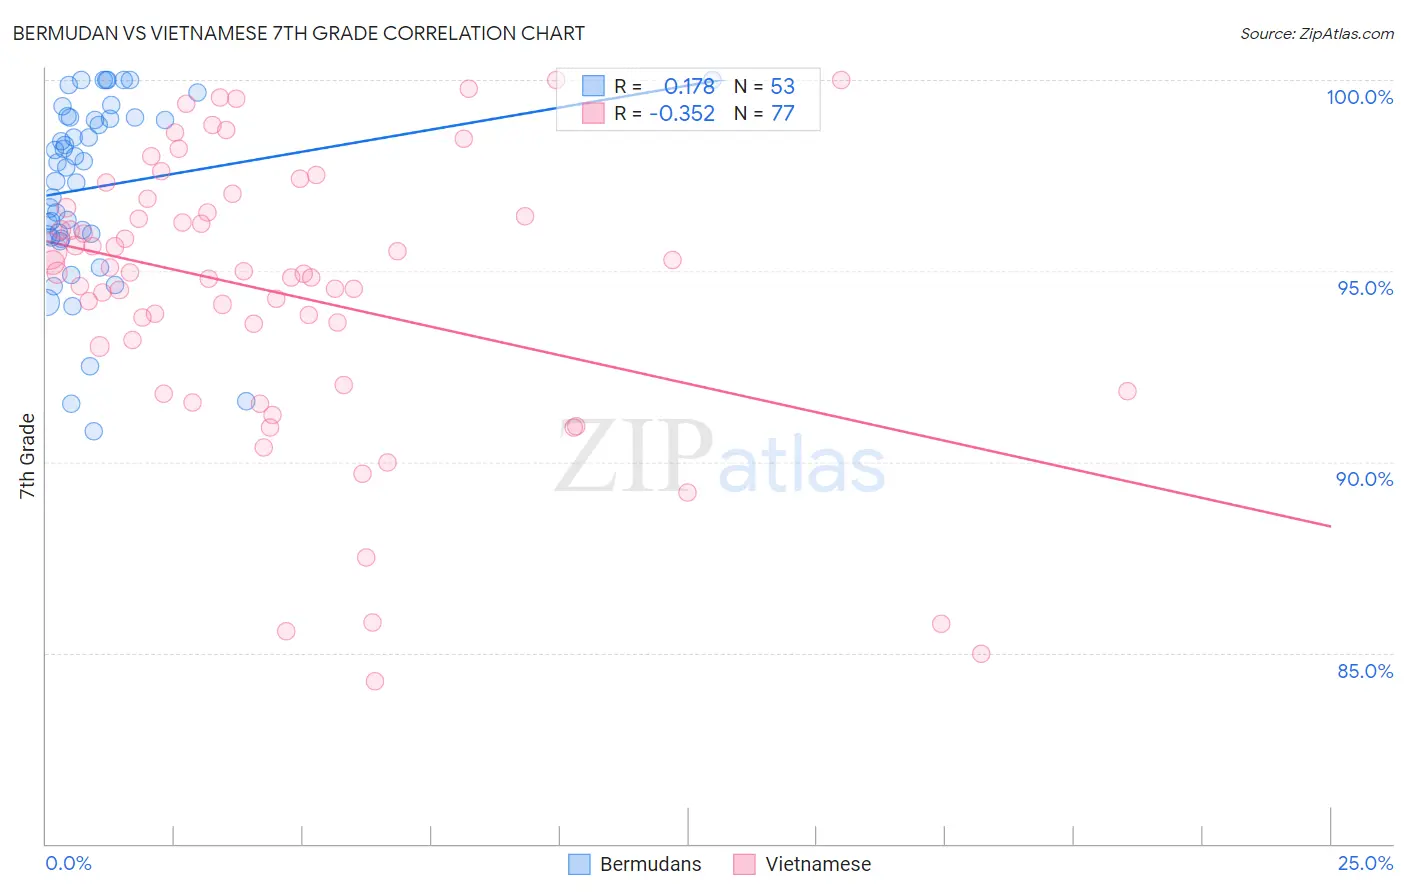
Bermudan vs Vietnamese 7th Grade Correlation Chart
The statistical analysis conducted on geographies consisting of 55,732,793 people shows a poor positive correlation between the proportion of Bermudans and percentage of population with at least 7th grade education in the United States with a correlation coefficient (R) of 0.178 and weighted average of 96.1%. Similarly, the statistical analysis conducted on geographies consisting of 170,728,240 people shows a mild negative correlation between the proportion of Vietnamese and percentage of population with at least 7th grade education in the United States with a correlation coefficient (R) of -0.352 and weighted average of 93.9%, a difference of 2.4%.
7th Grade Correlation Summary
| Measurement | Bermudan | Vietnamese |
| Minimum | 90.8% | 84.3% |
| Maximum | 100.0% | 100.0% |
| Range | 9.2% | 15.7% |
| Mean | 97.2% | 94.4% |
| Median | 97.8% | 95.0% |
| Interquartile 25% (IQ1) | 95.9% | 92.5% |
| Interquartile 75% (IQ3) | 99.0% | 96.6% |
| Interquartile Range (IQR) | 3.1% | 4.1% |
| Standard Deviation (Sample) | 2.4% | 3.6% |
| Standard Deviation (Population) | 2.3% | 3.6% |
Similar Demographics by 7th Grade
Demographics Similar to Bermudans by 7th Grade
In terms of 7th grade, the demographic groups most similar to Bermudans are Immigrants from Kenya (96.1%, a difference of 0.0%), Alsatian (96.1%, a difference of 0.010%), Pima (96.1%, a difference of 0.010%), Arab (96.2%, a difference of 0.020%), and Spaniard (96.1%, a difference of 0.020%).
| Demographics | Rating | Rank | 7th Grade |
| Immigrants | Israel | 77.6 /100 | #154 | Good 96.2% |
| Immigrants | Jordan | 77.0 /100 | #155 | Good 96.2% |
| Kenyans | 76.2 /100 | #156 | Good 96.2% |
| Ugandans | 75.5 /100 | #157 | Good 96.2% |
| Arabs | 68.6 /100 | #158 | Good 96.2% |
| Alsatians | 67.2 /100 | #159 | Good 96.1% |
| Immigrants | Kenya | 66.8 /100 | #160 | Good 96.1% |
| Bermudans | 66.3 /100 | #161 | Good 96.1% |
| Pima | 64.3 /100 | #162 | Good 96.1% |
| Spaniards | 62.6 /100 | #163 | Good 96.1% |
| Immigrants | Italy | 62.1 /100 | #164 | Good 96.1% |
| Immigrants | Taiwan | 61.5 /100 | #165 | Good 96.1% |
| Immigrants | Kazakhstan | 61.0 /100 | #166 | Good 96.1% |
| Immigrants | Sri Lanka | 59.9 /100 | #167 | Average 96.1% |
| Immigrants | Poland | 59.0 /100 | #168 | Average 96.1% |
Demographics Similar to Vietnamese by 7th Grade
In terms of 7th grade, the demographic groups most similar to Vietnamese are Immigrants from Vietnam (93.9%, a difference of 0.030%), Japanese (94.0%, a difference of 0.050%), Immigrants from Bangladesh (94.0%, a difference of 0.080%), Immigrants (94.0%, a difference of 0.090%), and Immigrants from Cuba (93.8%, a difference of 0.11%).
| Demographics | Rating | Rank | 7th Grade |
| Cape Verdeans | 0.0 /100 | #308 | Tragic 94.1% |
| Ecuadorians | 0.0 /100 | #309 | Tragic 94.0% |
| Immigrants | Caribbean | 0.0 /100 | #310 | Tragic 94.0% |
| Puerto Ricans | 0.0 /100 | #311 | Tragic 94.0% |
| Immigrants | Immigrants | 0.0 /100 | #312 | Tragic 94.0% |
| Immigrants | Bangladesh | 0.0 /100 | #313 | Tragic 94.0% |
| Japanese | 0.0 /100 | #314 | Tragic 94.0% |
| Vietnamese | 0.0 /100 | #315 | Tragic 93.9% |
| Immigrants | Vietnam | 0.0 /100 | #316 | Tragic 93.9% |
| Immigrants | Cuba | 0.0 /100 | #317 | Tragic 93.8% |
| Immigrants | Ecuador | 0.0 /100 | #318 | Tragic 93.7% |
| Immigrants | Cambodia | 0.0 /100 | #319 | Tragic 93.7% |
| Immigrants | Fiji | 0.0 /100 | #320 | Tragic 93.5% |
| Belizeans | 0.0 /100 | #321 | Tragic 93.5% |
| Nicaraguans | 0.0 /100 | #322 | Tragic 93.5% |