Bermudan vs Immigrants from Turkey Births to Unmarried Women
COMPARE
Bermudan
Immigrants from Turkey
Births to Unmarried Women
Births to Unmarried Women Comparison
Bermudans
Immigrants from Turkey
35.5%
BIRTHS TO UNMARRIED WOMEN
0.6/ 100
METRIC RATING
249th/ 347
METRIC RANK
28.1%
BIRTHS TO UNMARRIED WOMEN
99.1/ 100
METRIC RATING
60th/ 347
METRIC RANK
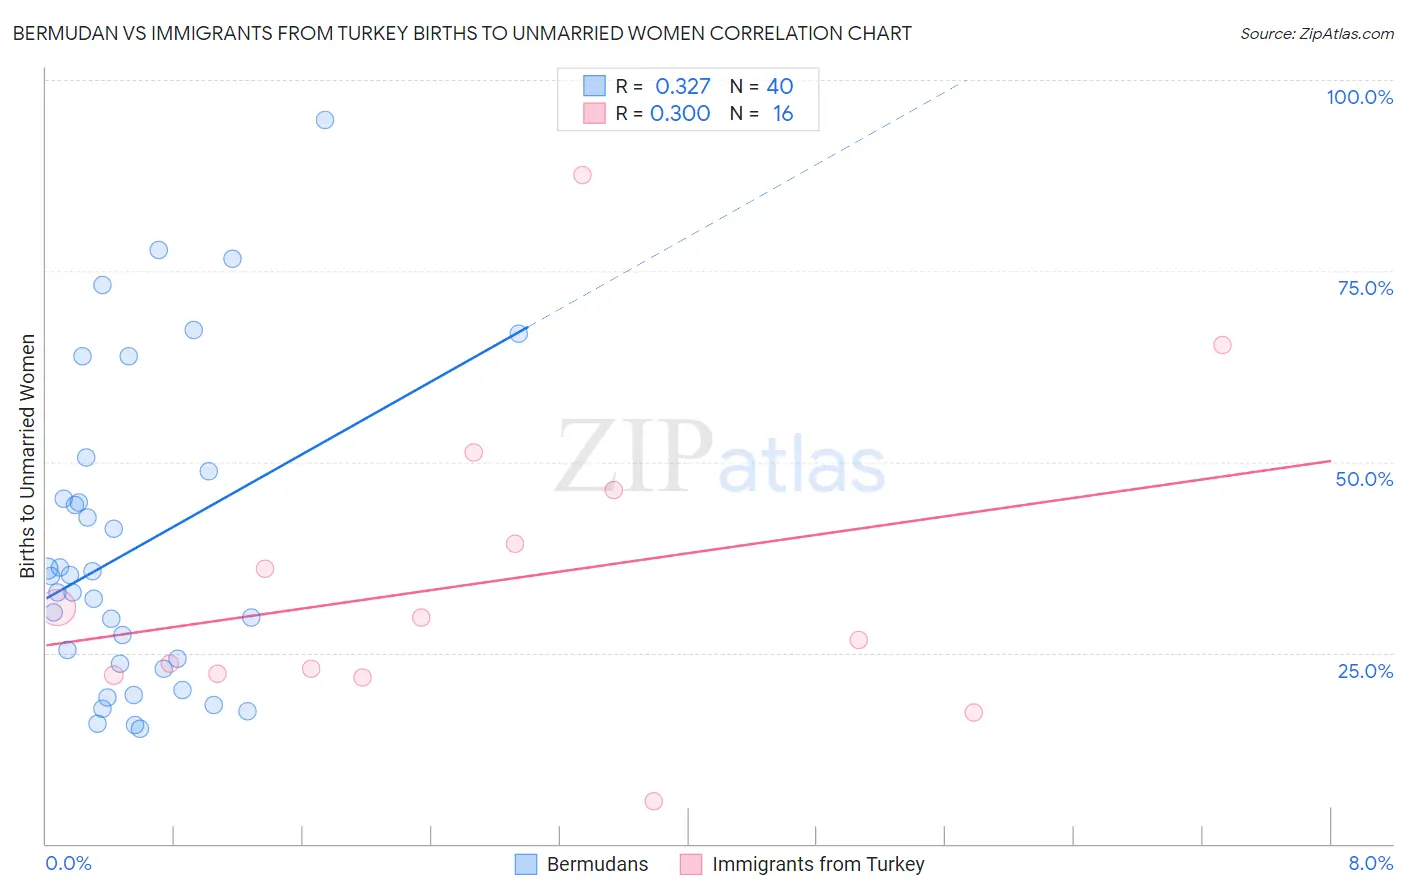
Bermudan vs Immigrants from Turkey Births to Unmarried Women Correlation Chart
The statistical analysis conducted on geographies consisting of 54,991,721 people shows a mild positive correlation between the proportion of Bermudans and percentage of births to unmarried women in the United States with a correlation coefficient (R) of 0.327 and weighted average of 35.5%. Similarly, the statistical analysis conducted on geographies consisting of 210,131,924 people shows a weak positive correlation between the proportion of Immigrants from Turkey and percentage of births to unmarried women in the United States with a correlation coefficient (R) of 0.300 and weighted average of 28.1%, a difference of 26.3%.
Births to Unmarried Women Correlation Summary
| Measurement | Bermudan | Immigrants from Turkey |
| Minimum | 15.1% | 5.6% |
| Maximum | 94.7% | 87.5% |
| Range | 79.6% | 81.9% |
| Mean | 38.7% | 34.3% |
| Median | 34.0% | 28.2% |
| Interquartile 25% (IQ1) | 23.2% | 22.2% |
| Interquartile 75% (IQ3) | 46.9% | 42.8% |
| Interquartile Range (IQR) | 23.7% | 20.6% |
| Standard Deviation (Sample) | 20.2% | 20.2% |
| Standard Deviation (Population) | 20.0% | 19.6% |
Similar Demographics by Births to Unmarried Women
Demographics Similar to Bermudans by Births to Unmarried Women
In terms of births to unmarried women, the demographic groups most similar to Bermudans are Nonimmigrants (35.5%, a difference of 0.010%), Immigrants from Nigeria (35.4%, a difference of 0.34%), Nigerian (35.3%, a difference of 0.55%), Mexican American Indian (35.7%, a difference of 0.61%), and Shoshone (35.3%, a difference of 0.66%).
| Demographics | Rating | Rank | Births to Unmarried Women |
| Indonesians | 1.2 /100 | #242 | Tragic 35.0% |
| Japanese | 0.9 /100 | #243 | Tragic 35.2% |
| Guyanese | 0.9 /100 | #244 | Tragic 35.2% |
| Shoshone | 0.8 /100 | #245 | Tragic 35.3% |
| Nigerians | 0.7 /100 | #246 | Tragic 35.3% |
| Immigrants | Nigeria | 0.7 /100 | #247 | Tragic 35.4% |
| Immigrants | Nonimmigrants | 0.6 /100 | #248 | Tragic 35.5% |
| Bermudans | 0.6 /100 | #249 | Tragic 35.5% |
| Mexican American Indians | 0.4 /100 | #250 | Tragic 35.7% |
| Immigrants | Western Africa | 0.3 /100 | #251 | Tragic 36.0% |
| Salvadorans | 0.3 /100 | #252 | Tragic 36.0% |
| Immigrants | Portugal | 0.2 /100 | #253 | Tragic 36.2% |
| Potawatomi | 0.2 /100 | #254 | Tragic 36.2% |
| Chickasaw | 0.2 /100 | #255 | Tragic 36.3% |
| Immigrants | Trinidad and Tobago | 0.2 /100 | #256 | Tragic 36.3% |
Demographics Similar to Immigrants from Turkey by Births to Unmarried Women
In terms of births to unmarried women, the demographic groups most similar to Immigrants from Turkey are Immigrants from Kazakhstan (28.1%, a difference of 0.040%), Immigrants from North Macedonia (28.1%, a difference of 0.040%), Immigrants from Albania (28.0%, a difference of 0.29%), Egyptian (28.2%, a difference of 0.36%), and Russian (28.0%, a difference of 0.41%).
| Demographics | Rating | Rank | Births to Unmarried Women |
| Immigrants | Romania | 99.4 /100 | #53 | Exceptional 27.9% |
| Afghans | 99.4 /100 | #54 | Exceptional 27.9% |
| Mongolians | 99.3 /100 | #55 | Exceptional 27.9% |
| Immigrants | Belgium | 99.3 /100 | #56 | Exceptional 28.0% |
| Russians | 99.2 /100 | #57 | Exceptional 28.0% |
| Immigrants | Albania | 99.2 /100 | #58 | Exceptional 28.0% |
| Immigrants | Kazakhstan | 99.1 /100 | #59 | Exceptional 28.1% |
| Immigrants | Turkey | 99.1 /100 | #60 | Exceptional 28.1% |
| Immigrants | North Macedonia | 99.1 /100 | #61 | Exceptional 28.1% |
| Egyptians | 99.0 /100 | #62 | Exceptional 28.2% |
| Immigrants | Serbia | 98.9 /100 | #63 | Exceptional 28.3% |
| Tongans | 98.8 /100 | #64 | Exceptional 28.4% |
| Immigrants | Czechoslovakia | 98.8 /100 | #65 | Exceptional 28.4% |
| Immigrants | Egypt | 98.8 /100 | #66 | Exceptional 28.4% |
| Palestinians | 98.7 /100 | #67 | Exceptional 28.4% |