Belizean vs Macedonian Births to Unmarried Women
COMPARE
Belizean
Macedonian
Births to Unmarried Women
Births to Unmarried Women Comparison
Belizeans
Macedonians
37.0%
BIRTHS TO UNMARRIED WOMEN
0.1/ 100
METRIC RATING
276th/ 347
METRIC RANK
27.9%
BIRTHS TO UNMARRIED WOMEN
99.4/ 100
METRIC RATING
51st/ 347
METRIC RANK
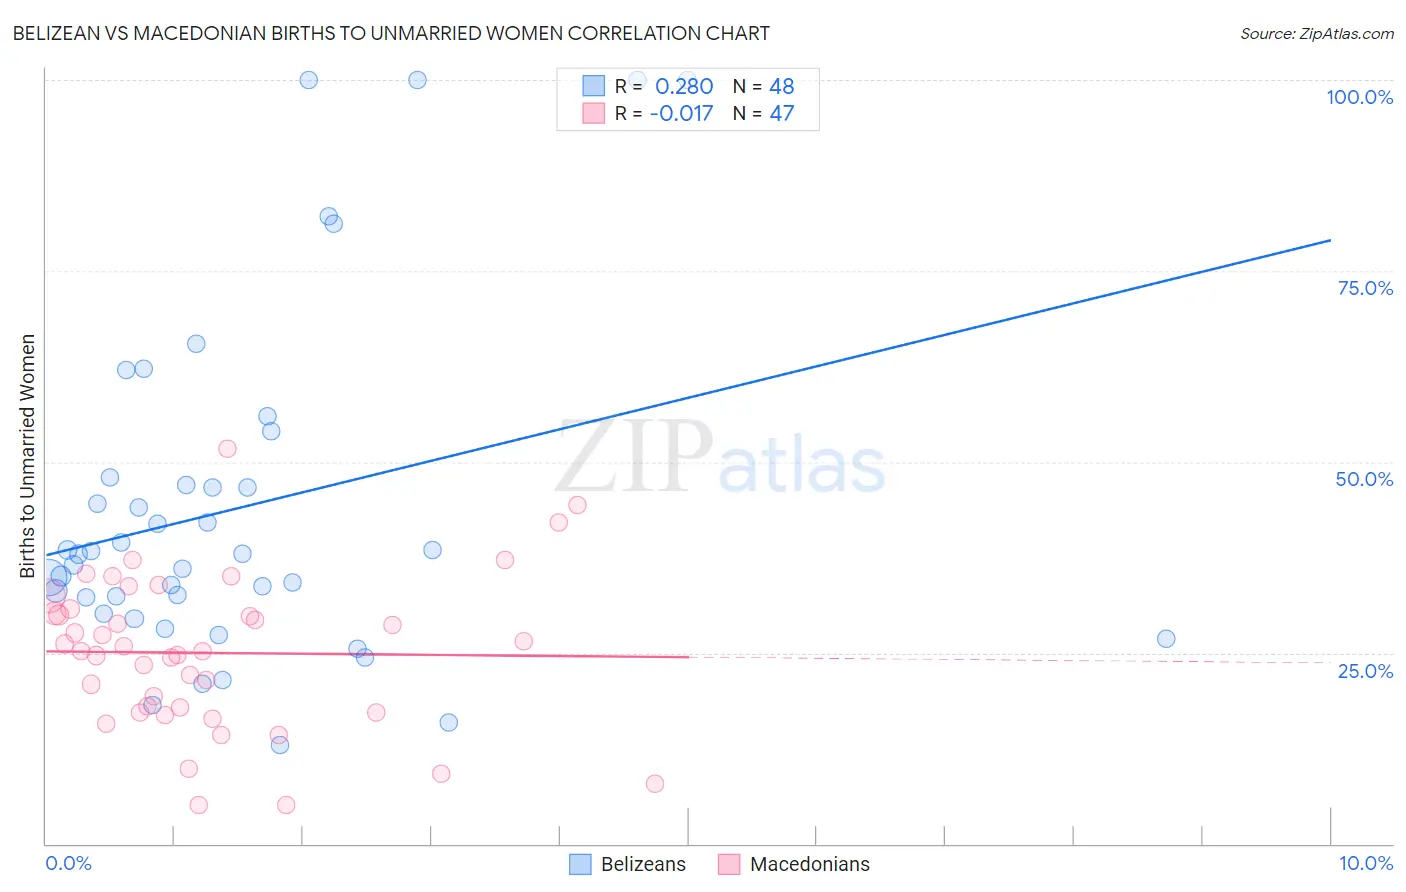
Belizean vs Macedonian Births to Unmarried Women Correlation Chart
The statistical analysis conducted on geographies consisting of 141,847,597 people shows a weak positive correlation between the proportion of Belizeans and percentage of births to unmarried women in the United States with a correlation coefficient (R) of 0.280 and weighted average of 37.0%. Similarly, the statistical analysis conducted on geographies consisting of 126,355,760 people shows no correlation between the proportion of Macedonians and percentage of births to unmarried women in the United States with a correlation coefficient (R) of -0.017 and weighted average of 27.9%, a difference of 32.9%.
Births to Unmarried Women Correlation Summary
| Measurement | Belizean | Macedonian |
| Minimum | 13.0% | 5.0% |
| Maximum | 100.0% | 51.8% |
| Range | 87.0% | 46.8% |
| Mean | 44.0% | 25.0% |
| Median | 38.0% | 25.3% |
| Interquartile 25% (IQ1) | 31.1% | 17.2% |
| Interquartile 75% (IQ3) | 47.5% | 30.8% |
| Interquartile Range (IQR) | 16.3% | 13.5% |
| Standard Deviation (Sample) | 22.4% | 10.1% |
| Standard Deviation (Population) | 22.1% | 10.0% |
Similar Demographics by Births to Unmarried Women
Demographics Similar to Belizeans by Births to Unmarried Women
In terms of births to unmarried women, the demographic groups most similar to Belizeans are Barbadian (37.0%, a difference of 0.19%), Cree (37.0%, a difference of 0.22%), Guatemalan (37.1%, a difference of 0.22%), Immigrants from Latin America (37.1%, a difference of 0.30%), and Mexican (36.9%, a difference of 0.31%).
| Demographics | Rating | Rank | Births to Unmarried Women |
| Senegalese | 0.1 /100 | #269 | Tragic 36.8% |
| Immigrants | Congo | 0.1 /100 | #270 | Tragic 36.8% |
| Immigrants | Barbados | 0.1 /100 | #271 | Tragic 36.8% |
| Choctaw | 0.1 /100 | #272 | Tragic 36.9% |
| Mexicans | 0.1 /100 | #273 | Tragic 36.9% |
| Cree | 0.1 /100 | #274 | Tragic 37.0% |
| Barbadians | 0.1 /100 | #275 | Tragic 37.0% |
| Belizeans | 0.1 /100 | #276 | Tragic 37.0% |
| Guatemalans | 0.1 /100 | #277 | Tragic 37.1% |
| Immigrants | Latin America | 0.1 /100 | #278 | Tragic 37.1% |
| West Indians | 0.1 /100 | #279 | Tragic 37.3% |
| Immigrants | St. Vincent and the Grenadines | 0.1 /100 | #280 | Tragic 37.3% |
| Immigrants | Belize | 0.1 /100 | #281 | Tragic 37.3% |
| Liberians | 0.0 /100 | #282 | Tragic 37.4% |
| Spanish American Indians | 0.0 /100 | #283 | Tragic 37.4% |
Demographics Similar to Macedonians by Births to Unmarried Women
In terms of births to unmarried women, the demographic groups most similar to Macedonians are Bhutanese (27.9%, a difference of 0.040%), Immigrants from Romania (27.9%, a difference of 0.050%), Afghan (27.9%, a difference of 0.12%), Maltese (27.8%, a difference of 0.13%), and Mongolian (27.9%, a difference of 0.16%).
| Demographics | Rating | Rank | Births to Unmarried Women |
| Immigrants | Indonesia | 99.5 /100 | #44 | Exceptional 27.7% |
| Latvians | 99.5 /100 | #45 | Exceptional 27.7% |
| Immigrants | Lithuania | 99.5 /100 | #46 | Exceptional 27.7% |
| Hmong | 99.5 /100 | #47 | Exceptional 27.7% |
| Eastern Europeans | 99.5 /100 | #48 | Exceptional 27.7% |
| Immigrants | Greece | 99.4 /100 | #49 | Exceptional 27.8% |
| Maltese | 99.4 /100 | #50 | Exceptional 27.8% |
| Macedonians | 99.4 /100 | #51 | Exceptional 27.9% |
| Bhutanese | 99.4 /100 | #52 | Exceptional 27.9% |
| Immigrants | Romania | 99.4 /100 | #53 | Exceptional 27.9% |
| Afghans | 99.4 /100 | #54 | Exceptional 27.9% |
| Mongolians | 99.3 /100 | #55 | Exceptional 27.9% |
| Immigrants | Belgium | 99.3 /100 | #56 | Exceptional 28.0% |
| Russians | 99.2 /100 | #57 | Exceptional 28.0% |
| Immigrants | Albania | 99.2 /100 | #58 | Exceptional 28.0% |