Belizean vs Jamaican Births to Unmarried Women
COMPARE
Belizean
Jamaican
Births to Unmarried Women
Births to Unmarried Women Comparison
Belizeans
Jamaicans
37.0%
BIRTHS TO UNMARRIED WOMEN
0.1/ 100
METRIC RATING
276th/ 347
METRIC RANK
38.5%
BIRTHS TO UNMARRIED WOMEN
0.0/ 100
METRIC RATING
298th/ 347
METRIC RANK
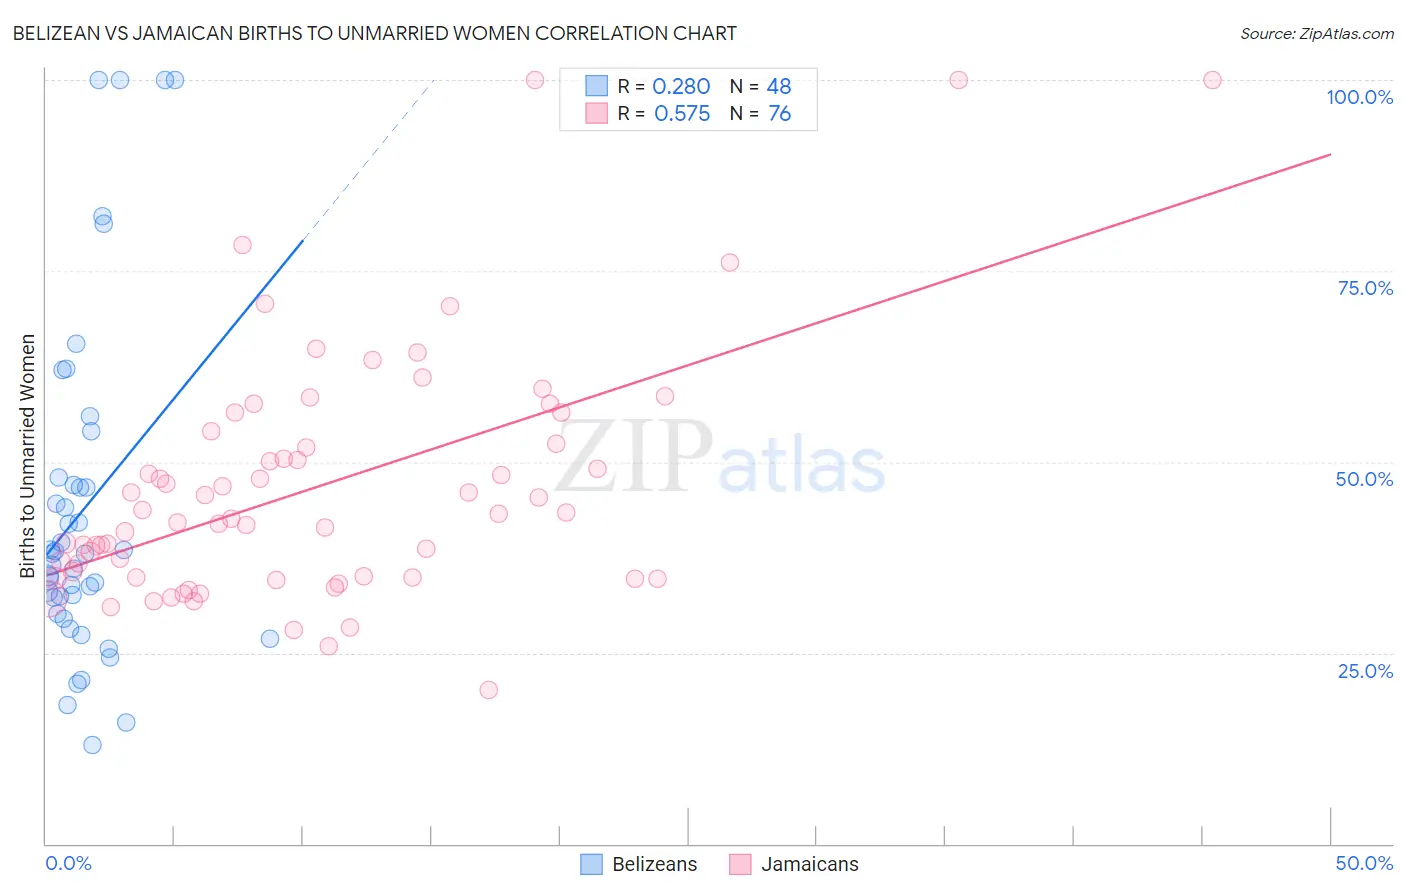
Belizean vs Jamaican Births to Unmarried Women Correlation Chart
The statistical analysis conducted on geographies consisting of 141,847,597 people shows a weak positive correlation between the proportion of Belizeans and percentage of births to unmarried women in the United States with a correlation coefficient (R) of 0.280 and weighted average of 37.0%. Similarly, the statistical analysis conducted on geographies consisting of 347,671,371 people shows a substantial positive correlation between the proportion of Jamaicans and percentage of births to unmarried women in the United States with a correlation coefficient (R) of 0.575 and weighted average of 38.5%, a difference of 3.9%.
Births to Unmarried Women Correlation Summary
| Measurement | Belizean | Jamaican |
| Minimum | 13.0% | 20.2% |
| Maximum | 100.0% | 100.0% |
| Range | 87.0% | 79.8% |
| Mean | 44.0% | 46.7% |
| Median | 38.0% | 42.9% |
| Interquartile 25% (IQ1) | 31.1% | 34.9% |
| Interquartile 75% (IQ3) | 47.5% | 53.2% |
| Interquartile Range (IQR) | 16.3% | 18.3% |
| Standard Deviation (Sample) | 22.4% | 16.1% |
| Standard Deviation (Population) | 22.1% | 16.0% |
Similar Demographics by Births to Unmarried Women
Demographics Similar to Belizeans by Births to Unmarried Women
In terms of births to unmarried women, the demographic groups most similar to Belizeans are Barbadian (37.0%, a difference of 0.19%), Cree (37.0%, a difference of 0.22%), Guatemalan (37.1%, a difference of 0.22%), Immigrants from Latin America (37.1%, a difference of 0.30%), and Mexican (36.9%, a difference of 0.31%).
| Demographics | Rating | Rank | Births to Unmarried Women |
| Senegalese | 0.1 /100 | #269 | Tragic 36.8% |
| Immigrants | Congo | 0.1 /100 | #270 | Tragic 36.8% |
| Immigrants | Barbados | 0.1 /100 | #271 | Tragic 36.8% |
| Choctaw | 0.1 /100 | #272 | Tragic 36.9% |
| Mexicans | 0.1 /100 | #273 | Tragic 36.9% |
| Cree | 0.1 /100 | #274 | Tragic 37.0% |
| Barbadians | 0.1 /100 | #275 | Tragic 37.0% |
| Belizeans | 0.1 /100 | #276 | Tragic 37.0% |
| Guatemalans | 0.1 /100 | #277 | Tragic 37.1% |
| Immigrants | Latin America | 0.1 /100 | #278 | Tragic 37.1% |
| West Indians | 0.1 /100 | #279 | Tragic 37.3% |
| Immigrants | St. Vincent and the Grenadines | 0.1 /100 | #280 | Tragic 37.3% |
| Immigrants | Belize | 0.1 /100 | #281 | Tragic 37.3% |
| Liberians | 0.0 /100 | #282 | Tragic 37.4% |
| Spanish American Indians | 0.0 /100 | #283 | Tragic 37.4% |
Demographics Similar to Jamaicans by Births to Unmarried Women
In terms of births to unmarried women, the demographic groups most similar to Jamaicans are Dutch West Indian (38.4%, a difference of 0.20%), Spanish American (38.6%, a difference of 0.20%), Immigrants from West Indies (38.6%, a difference of 0.26%), Haitian (38.6%, a difference of 0.27%), and Alaska Native (38.3%, a difference of 0.48%).
| Demographics | Rating | Rank | Births to Unmarried Women |
| Seminole | 0.0 /100 | #291 | Tragic 37.9% |
| Blackfeet | 0.0 /100 | #292 | Tragic 37.9% |
| Immigrants | Nicaragua | 0.0 /100 | #293 | Tragic 38.0% |
| British West Indians | 0.0 /100 | #294 | Tragic 38.0% |
| Iroquois | 0.0 /100 | #295 | Tragic 38.2% |
| Alaska Natives | 0.0 /100 | #296 | Tragic 38.3% |
| Dutch West Indians | 0.0 /100 | #297 | Tragic 38.4% |
| Jamaicans | 0.0 /100 | #298 | Tragic 38.5% |
| Spanish Americans | 0.0 /100 | #299 | Tragic 38.6% |
| Immigrants | West Indies | 0.0 /100 | #300 | Tragic 38.6% |
| Haitians | 0.0 /100 | #301 | Tragic 38.6% |
| Hondurans | 0.0 /100 | #302 | Tragic 38.7% |
| Immigrants | Jamaica | 0.0 /100 | #303 | Tragic 38.8% |
| Yaqui | 0.0 /100 | #304 | Tragic 38.8% |
| Immigrants | Haiti | 0.0 /100 | #305 | Tragic 38.9% |