Dominican vs Macedonian Births to Unmarried Women
COMPARE
Dominican
Macedonian
Births to Unmarried Women
Births to Unmarried Women Comparison
Dominicans
Macedonians
39.8%
BIRTHS TO UNMARRIED WOMEN
0.0/ 100
METRIC RATING
315th/ 347
METRIC RANK
27.9%
BIRTHS TO UNMARRIED WOMEN
99.4/ 100
METRIC RATING
51st/ 347
METRIC RANK
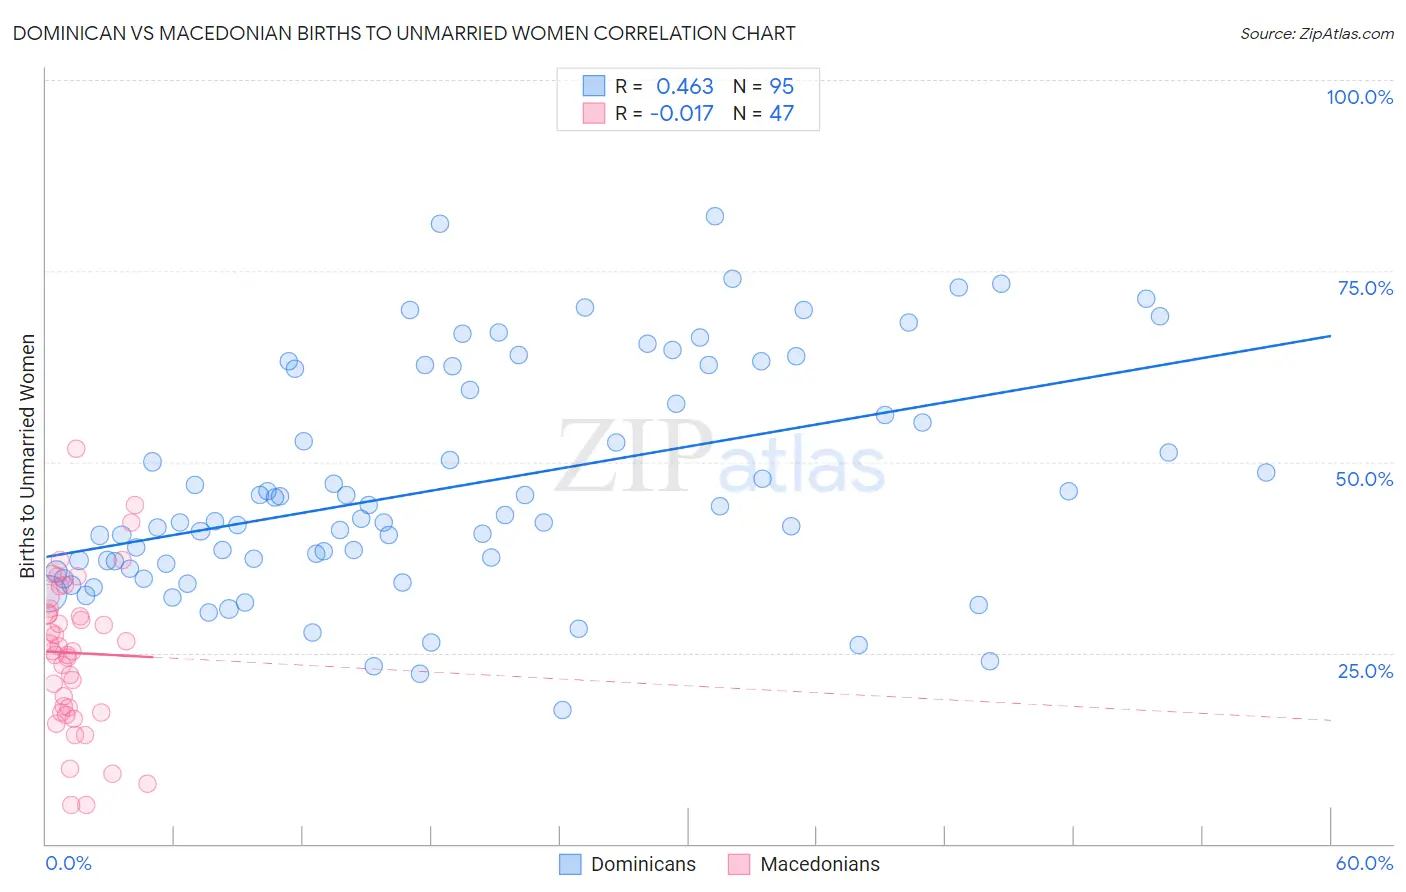
Dominican vs Macedonian Births to Unmarried Women Correlation Chart
The statistical analysis conducted on geographies consisting of 335,131,463 people shows a moderate positive correlation between the proportion of Dominicans and percentage of births to unmarried women in the United States with a correlation coefficient (R) of 0.463 and weighted average of 39.8%. Similarly, the statistical analysis conducted on geographies consisting of 126,355,760 people shows no correlation between the proportion of Macedonians and percentage of births to unmarried women in the United States with a correlation coefficient (R) of -0.017 and weighted average of 27.9%, a difference of 43.0%.
Births to Unmarried Women Correlation Summary
| Measurement | Dominican | Macedonian |
| Minimum | 17.5% | 5.0% |
| Maximum | 82.1% | 51.8% |
| Range | 64.6% | 46.8% |
| Mean | 46.9% | 25.0% |
| Median | 42.5% | 25.3% |
| Interquartile 25% (IQ1) | 36.6% | 17.2% |
| Interquartile 75% (IQ3) | 62.2% | 30.8% |
| Interquartile Range (IQR) | 25.6% | 13.5% |
| Standard Deviation (Sample) | 14.8% | 10.1% |
| Standard Deviation (Population) | 14.7% | 10.0% |
Similar Demographics by Births to Unmarried Women
Demographics Similar to Dominicans by Births to Unmarried Women
In terms of births to unmarried women, the demographic groups most similar to Dominicans are Immigrants from Caribbean (39.8%, a difference of 0.040%), Apache (39.9%, a difference of 0.060%), African (39.7%, a difference of 0.33%), Immigrants from Dominican Republic (40.1%, a difference of 0.61%), and U.S. Virgin Islander (39.6%, a difference of 0.67%).
| Demographics | Rating | Rank | Births to Unmarried Women |
| Aleuts | 0.0 /100 | #308 | Tragic 39.3% |
| Cubans | 0.0 /100 | #309 | Tragic 39.4% |
| Immigrants | Dominica | 0.0 /100 | #310 | Tragic 39.5% |
| Immigrants | Azores | 0.0 /100 | #311 | Tragic 39.6% |
| U.S. Virgin Islanders | 0.0 /100 | #312 | Tragic 39.6% |
| Africans | 0.0 /100 | #313 | Tragic 39.7% |
| Immigrants | Caribbean | 0.0 /100 | #314 | Tragic 39.8% |
| Dominicans | 0.0 /100 | #315 | Tragic 39.8% |
| Apache | 0.0 /100 | #316 | Tragic 39.9% |
| Immigrants | Dominican Republic | 0.0 /100 | #317 | Tragic 40.1% |
| Immigrants | Bahamas | 0.0 /100 | #318 | Tragic 40.1% |
| Yakama | 0.0 /100 | #319 | Tragic 40.3% |
| Crow | 0.0 /100 | #320 | Tragic 40.4% |
| Bahamians | 0.0 /100 | #321 | Tragic 40.8% |
| Cajuns | 0.0 /100 | #322 | Tragic 41.0% |
Demographics Similar to Macedonians by Births to Unmarried Women
In terms of births to unmarried women, the demographic groups most similar to Macedonians are Bhutanese (27.9%, a difference of 0.040%), Immigrants from Romania (27.9%, a difference of 0.050%), Afghan (27.9%, a difference of 0.12%), Maltese (27.8%, a difference of 0.13%), and Mongolian (27.9%, a difference of 0.16%).
| Demographics | Rating | Rank | Births to Unmarried Women |
| Immigrants | Indonesia | 99.5 /100 | #44 | Exceptional 27.7% |
| Latvians | 99.5 /100 | #45 | Exceptional 27.7% |
| Immigrants | Lithuania | 99.5 /100 | #46 | Exceptional 27.7% |
| Hmong | 99.5 /100 | #47 | Exceptional 27.7% |
| Eastern Europeans | 99.5 /100 | #48 | Exceptional 27.7% |
| Immigrants | Greece | 99.4 /100 | #49 | Exceptional 27.8% |
| Maltese | 99.4 /100 | #50 | Exceptional 27.8% |
| Macedonians | 99.4 /100 | #51 | Exceptional 27.9% |
| Bhutanese | 99.4 /100 | #52 | Exceptional 27.9% |
| Immigrants | Romania | 99.4 /100 | #53 | Exceptional 27.9% |
| Afghans | 99.4 /100 | #54 | Exceptional 27.9% |
| Mongolians | 99.3 /100 | #55 | Exceptional 27.9% |
| Immigrants | Belgium | 99.3 /100 | #56 | Exceptional 28.0% |
| Russians | 99.2 /100 | #57 | Exceptional 28.0% |
| Immigrants | Albania | 99.2 /100 | #58 | Exceptional 28.0% |