Maltese vs Macedonian Births to Unmarried Women
COMPARE
Maltese
Macedonian
Births to Unmarried Women
Births to Unmarried Women Comparison
Maltese
Macedonians
27.8%
BIRTHS TO UNMARRIED WOMEN
99.4/ 100
METRIC RATING
50th/ 347
METRIC RANK
27.9%
BIRTHS TO UNMARRIED WOMEN
99.4/ 100
METRIC RATING
51st/ 347
METRIC RANK
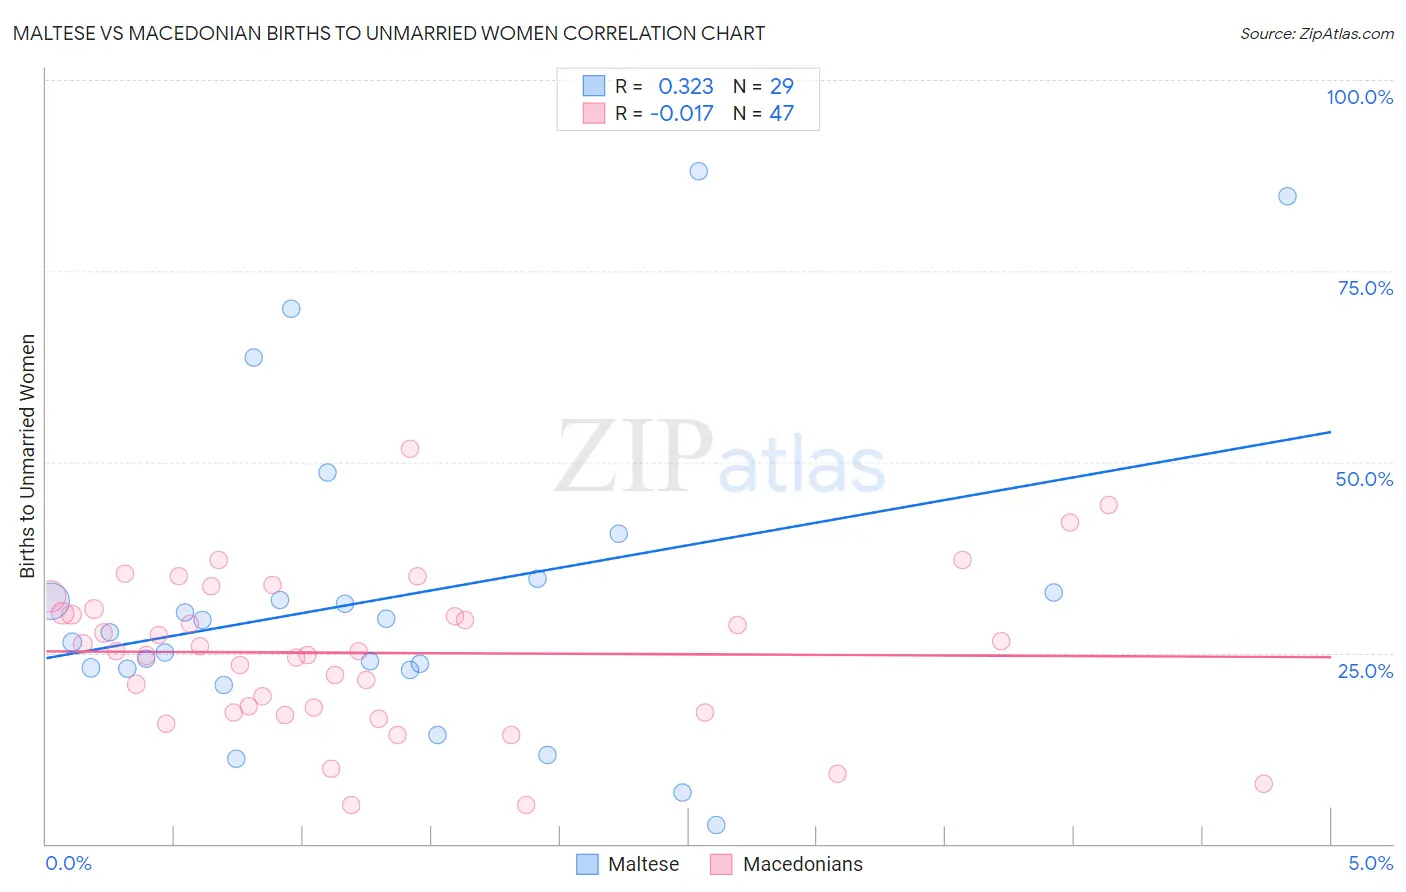
Maltese vs Macedonian Births to Unmarried Women Correlation Chart
The statistical analysis conducted on geographies consisting of 121,147,000 people shows a mild positive correlation between the proportion of Maltese and percentage of births to unmarried women in the United States with a correlation coefficient (R) of 0.323 and weighted average of 27.8%. Similarly, the statistical analysis conducted on geographies consisting of 126,355,760 people shows no correlation between the proportion of Macedonians and percentage of births to unmarried women in the United States with a correlation coefficient (R) of -0.017 and weighted average of 27.9%, a difference of 0.13%.
Births to Unmarried Women Correlation Summary
| Measurement | Maltese | Macedonian |
| Minimum | 2.4% | 5.0% |
| Maximum | 88.0% | 51.8% |
| Range | 85.6% | 46.8% |
| Mean | 32.2% | 25.0% |
| Median | 27.6% | 25.3% |
| Interquartile 25% (IQ1) | 22.9% | 17.2% |
| Interquartile 75% (IQ3) | 33.8% | 30.8% |
| Interquartile Range (IQR) | 10.9% | 13.5% |
| Standard Deviation (Sample) | 20.8% | 10.1% |
| Standard Deviation (Population) | 20.4% | 10.0% |
Demographics Similar to Maltese and Macedonians by Births to Unmarried Women
In terms of births to unmarried women, the demographic groups most similar to Maltese are Immigrants from Greece (27.8%, a difference of 0.12%), Bhutanese (27.9%, a difference of 0.17%), Immigrants from Romania (27.9%, a difference of 0.19%), Afghan (27.9%, a difference of 0.25%), and Mongolian (27.9%, a difference of 0.29%). Similarly, the demographic groups most similar to Macedonians are Bhutanese (27.9%, a difference of 0.040%), Immigrants from Romania (27.9%, a difference of 0.050%), Afghan (27.9%, a difference of 0.12%), Mongolian (27.9%, a difference of 0.16%), and Immigrants from Greece (27.8%, a difference of 0.26%).
| Demographics | Rating | Rank | Births to Unmarried Women |
| Turks | 99.6 /100 | #40 | Exceptional 27.4% |
| Iraqis | 99.6 /100 | #41 | Exceptional 27.6% |
| Immigrants | Eastern Europe | 99.6 /100 | #42 | Exceptional 27.6% |
| Immigrants | Bulgaria | 99.6 /100 | #43 | Exceptional 27.6% |
| Immigrants | Indonesia | 99.5 /100 | #44 | Exceptional 27.7% |
| Latvians | 99.5 /100 | #45 | Exceptional 27.7% |
| Immigrants | Lithuania | 99.5 /100 | #46 | Exceptional 27.7% |
| Hmong | 99.5 /100 | #47 | Exceptional 27.7% |
| Eastern Europeans | 99.5 /100 | #48 | Exceptional 27.7% |
| Immigrants | Greece | 99.4 /100 | #49 | Exceptional 27.8% |
| Maltese | 99.4 /100 | #50 | Exceptional 27.8% |
| Macedonians | 99.4 /100 | #51 | Exceptional 27.9% |
| Bhutanese | 99.4 /100 | #52 | Exceptional 27.9% |
| Immigrants | Romania | 99.4 /100 | #53 | Exceptional 27.9% |
| Afghans | 99.4 /100 | #54 | Exceptional 27.9% |
| Mongolians | 99.3 /100 | #55 | Exceptional 27.9% |
| Immigrants | Belgium | 99.3 /100 | #56 | Exceptional 28.0% |
| Russians | 99.2 /100 | #57 | Exceptional 28.0% |
| Immigrants | Albania | 99.2 /100 | #58 | Exceptional 28.0% |
| Immigrants | Kazakhstan | 99.1 /100 | #59 | Exceptional 28.1% |
| Immigrants | Turkey | 99.1 /100 | #60 | Exceptional 28.1% |