Belizean vs Blackfeet Births to Unmarried Women
COMPARE
Belizean
Blackfeet
Births to Unmarried Women
Births to Unmarried Women Comparison
Belizeans
Blackfeet
37.0%
BIRTHS TO UNMARRIED WOMEN
0.1/ 100
METRIC RATING
276th/ 347
METRIC RANK
37.9%
BIRTHS TO UNMARRIED WOMEN
0.0/ 100
METRIC RATING
292nd/ 347
METRIC RANK
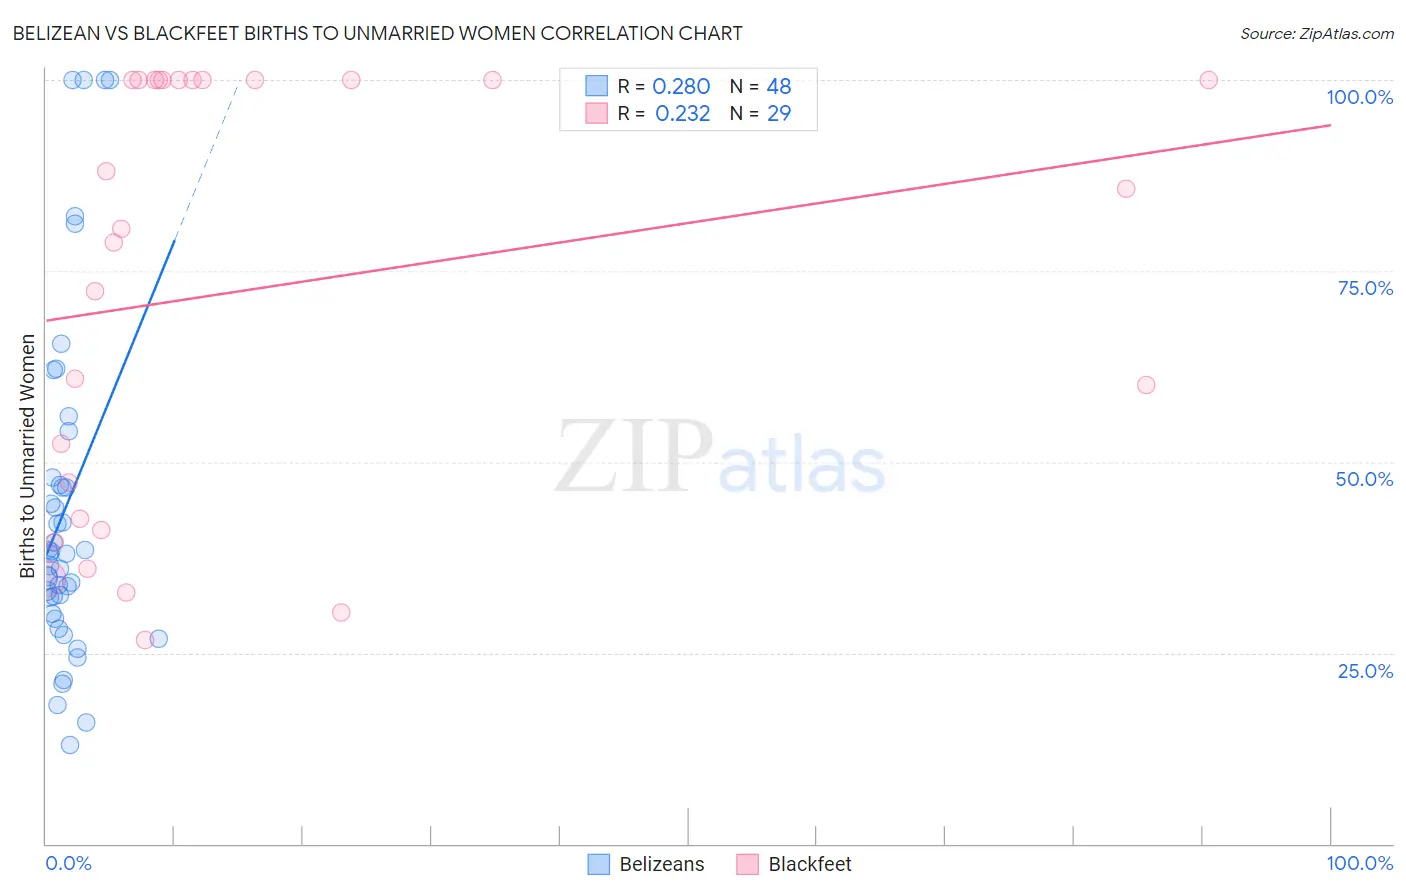
Belizean vs Blackfeet Births to Unmarried Women Correlation Chart
The statistical analysis conducted on geographies consisting of 141,847,597 people shows a weak positive correlation between the proportion of Belizeans and percentage of births to unmarried women in the United States with a correlation coefficient (R) of 0.280 and weighted average of 37.0%. Similarly, the statistical analysis conducted on geographies consisting of 296,921,104 people shows a weak positive correlation between the proportion of Blackfeet and percentage of births to unmarried women in the United States with a correlation coefficient (R) of 0.232 and weighted average of 37.9%, a difference of 2.4%.
Births to Unmarried Women Correlation Summary
| Measurement | Belizean | Blackfeet |
| Minimum | 13.0% | 26.7% |
| Maximum | 100.0% | 100.0% |
| Range | 87.0% | 73.3% |
| Mean | 44.0% | 72.7% |
| Median | 38.0% | 80.5% |
| Interquartile 25% (IQ1) | 31.1% | 41.8% |
| Interquartile 75% (IQ3) | 47.5% | 100.0% |
| Interquartile Range (IQR) | 16.3% | 58.2% |
| Standard Deviation (Sample) | 22.4% | 28.1% |
| Standard Deviation (Population) | 22.1% | 27.6% |
Demographics Similar to Belizeans and Blackfeet by Births to Unmarried Women
In terms of births to unmarried women, the demographic groups most similar to Belizeans are Barbadian (37.0%, a difference of 0.19%), Cree (37.0%, a difference of 0.22%), Guatemalan (37.1%, a difference of 0.22%), Immigrants from Latin America (37.1%, a difference of 0.30%), and West Indian (37.3%, a difference of 0.63%). Similarly, the demographic groups most similar to Blackfeet are Seminole (37.9%, a difference of 0.050%), Immigrants from Nicaragua (38.0%, a difference of 0.15%), British West Indian (38.0%, a difference of 0.20%), Hispanic or Latino (37.8%, a difference of 0.39%), and Alaskan Athabascan (37.7%, a difference of 0.52%).
| Demographics | Rating | Rank | Births to Unmarried Women |
| Cree | 0.1 /100 | #274 | Tragic 37.0% |
| Barbadians | 0.1 /100 | #275 | Tragic 37.0% |
| Belizeans | 0.1 /100 | #276 | Tragic 37.0% |
| Guatemalans | 0.1 /100 | #277 | Tragic 37.1% |
| Immigrants | Latin America | 0.1 /100 | #278 | Tragic 37.1% |
| West Indians | 0.1 /100 | #279 | Tragic 37.3% |
| Immigrants | St. Vincent and the Grenadines | 0.1 /100 | #280 | Tragic 37.3% |
| Immigrants | Belize | 0.1 /100 | #281 | Tragic 37.3% |
| Liberians | 0.0 /100 | #282 | Tragic 37.4% |
| Spanish American Indians | 0.0 /100 | #283 | Tragic 37.4% |
| Immigrants | Central America | 0.0 /100 | #284 | Tragic 37.4% |
| Immigrants | Mexico | 0.0 /100 | #285 | Tragic 37.5% |
| Immigrants | Guatemala | 0.0 /100 | #286 | Tragic 37.5% |
| Creek | 0.0 /100 | #287 | Tragic 37.6% |
| Immigrants | Liberia | 0.0 /100 | #288 | Tragic 37.6% |
| Alaskan Athabascans | 0.0 /100 | #289 | Tragic 37.7% |
| Hispanics or Latinos | 0.0 /100 | #290 | Tragic 37.8% |
| Seminole | 0.0 /100 | #291 | Tragic 37.9% |
| Blackfeet | 0.0 /100 | #292 | Tragic 37.9% |
| Immigrants | Nicaragua | 0.0 /100 | #293 | Tragic 38.0% |
| British West Indians | 0.0 /100 | #294 | Tragic 38.0% |