Immigrants from Honduras vs Macedonian Births to Unmarried Women
COMPARE
Immigrants from Honduras
Macedonian
Births to Unmarried Women
Births to Unmarried Women Comparison
Immigrants from Honduras
Macedonians
39.3%
BIRTHS TO UNMARRIED WOMEN
0.0/ 100
METRIC RATING
307th/ 347
METRIC RANK
27.9%
BIRTHS TO UNMARRIED WOMEN
99.4/ 100
METRIC RATING
51st/ 347
METRIC RANK
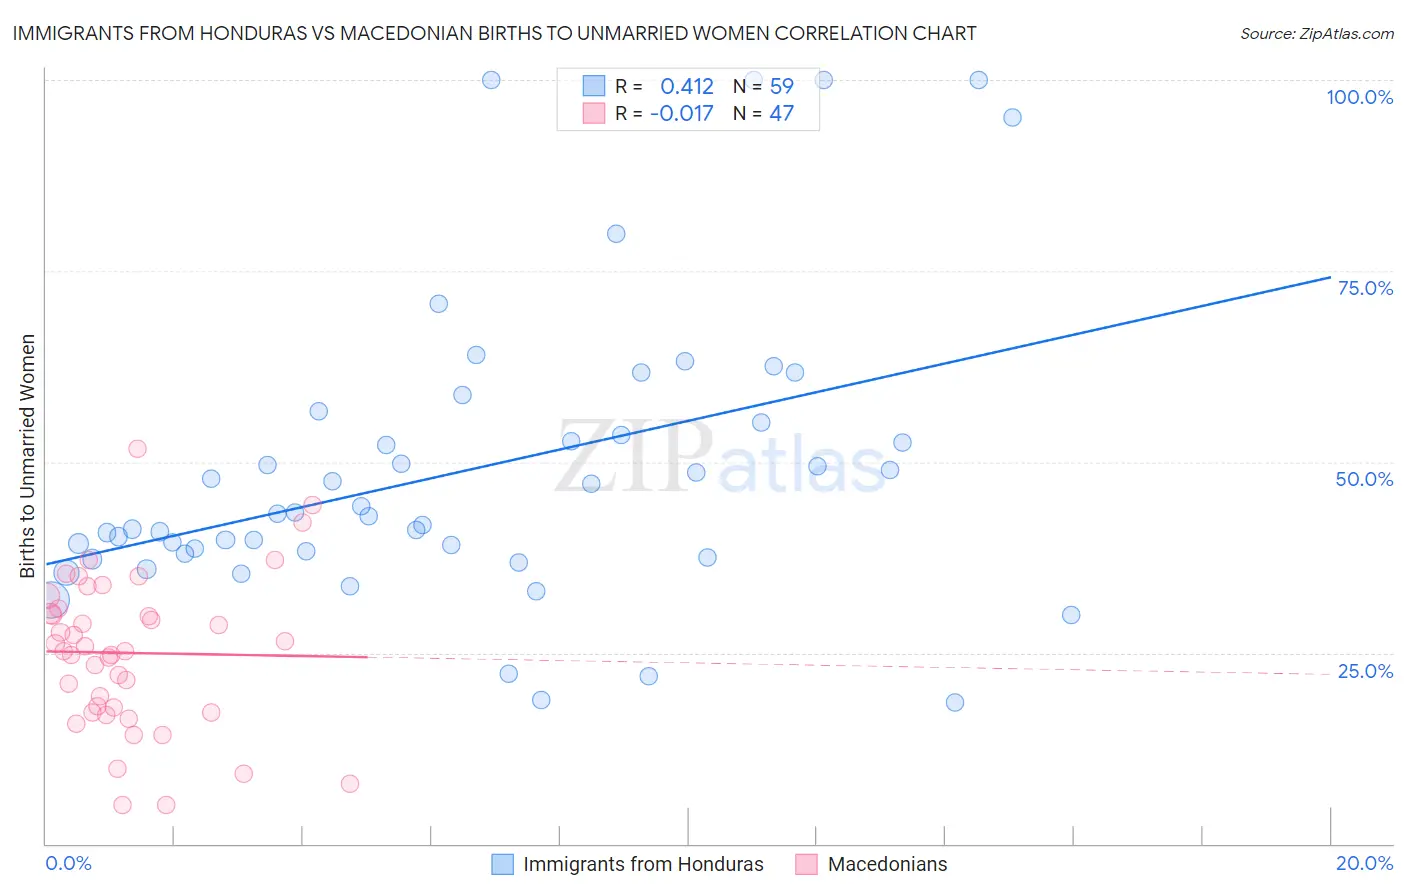
Immigrants from Honduras vs Macedonian Births to Unmarried Women Correlation Chart
The statistical analysis conducted on geographies consisting of 311,068,585 people shows a moderate positive correlation between the proportion of Immigrants from Honduras and percentage of births to unmarried women in the United States with a correlation coefficient (R) of 0.412 and weighted average of 39.3%. Similarly, the statistical analysis conducted on geographies consisting of 126,355,760 people shows no correlation between the proportion of Macedonians and percentage of births to unmarried women in the United States with a correlation coefficient (R) of -0.017 and weighted average of 27.9%, a difference of 41.0%.
Births to Unmarried Women Correlation Summary
| Measurement | Immigrants from Honduras | Macedonian |
| Minimum | 18.5% | 5.0% |
| Maximum | 100.0% | 51.8% |
| Range | 81.5% | 46.8% |
| Mean | 49.0% | 25.0% |
| Median | 43.2% | 25.3% |
| Interquartile 25% (IQ1) | 38.0% | 17.2% |
| Interquartile 75% (IQ3) | 55.1% | 30.8% |
| Interquartile Range (IQR) | 17.1% | 13.5% |
| Standard Deviation (Sample) | 19.4% | 10.1% |
| Standard Deviation (Population) | 19.2% | 10.0% |
Similar Demographics by Births to Unmarried Women
Demographics Similar to Immigrants from Honduras by Births to Unmarried Women
In terms of births to unmarried women, the demographic groups most similar to Immigrants from Honduras are Aleut (39.3%, a difference of 0.090%), Cuban (39.4%, a difference of 0.21%), Immigrants from Dominica (39.5%, a difference of 0.43%), Immigrants from the Azores (39.6%, a difference of 0.67%), and U.S. Virgin Islander (39.6%, a difference of 0.69%).
| Demographics | Rating | Rank | Births to Unmarried Women |
| Immigrants | West Indies | 0.0 /100 | #300 | Tragic 38.6% |
| Haitians | 0.0 /100 | #301 | Tragic 38.6% |
| Hondurans | 0.0 /100 | #302 | Tragic 38.7% |
| Immigrants | Jamaica | 0.0 /100 | #303 | Tragic 38.8% |
| Yaqui | 0.0 /100 | #304 | Tragic 38.8% |
| Immigrants | Haiti | 0.0 /100 | #305 | Tragic 38.9% |
| Central American Indians | 0.0 /100 | #306 | Tragic 39.0% |
| Immigrants | Honduras | 0.0 /100 | #307 | Tragic 39.3% |
| Aleuts | 0.0 /100 | #308 | Tragic 39.3% |
| Cubans | 0.0 /100 | #309 | Tragic 39.4% |
| Immigrants | Dominica | 0.0 /100 | #310 | Tragic 39.5% |
| Immigrants | Azores | 0.0 /100 | #311 | Tragic 39.6% |
| U.S. Virgin Islanders | 0.0 /100 | #312 | Tragic 39.6% |
| Africans | 0.0 /100 | #313 | Tragic 39.7% |
| Immigrants | Caribbean | 0.0 /100 | #314 | Tragic 39.8% |
Demographics Similar to Macedonians by Births to Unmarried Women
In terms of births to unmarried women, the demographic groups most similar to Macedonians are Bhutanese (27.9%, a difference of 0.040%), Immigrants from Romania (27.9%, a difference of 0.050%), Afghan (27.9%, a difference of 0.12%), Maltese (27.8%, a difference of 0.13%), and Mongolian (27.9%, a difference of 0.16%).
| Demographics | Rating | Rank | Births to Unmarried Women |
| Immigrants | Indonesia | 99.5 /100 | #44 | Exceptional 27.7% |
| Latvians | 99.5 /100 | #45 | Exceptional 27.7% |
| Immigrants | Lithuania | 99.5 /100 | #46 | Exceptional 27.7% |
| Hmong | 99.5 /100 | #47 | Exceptional 27.7% |
| Eastern Europeans | 99.5 /100 | #48 | Exceptional 27.7% |
| Immigrants | Greece | 99.4 /100 | #49 | Exceptional 27.8% |
| Maltese | 99.4 /100 | #50 | Exceptional 27.8% |
| Macedonians | 99.4 /100 | #51 | Exceptional 27.9% |
| Bhutanese | 99.4 /100 | #52 | Exceptional 27.9% |
| Immigrants | Romania | 99.4 /100 | #53 | Exceptional 27.9% |
| Afghans | 99.4 /100 | #54 | Exceptional 27.9% |
| Mongolians | 99.3 /100 | #55 | Exceptional 27.9% |
| Immigrants | Belgium | 99.3 /100 | #56 | Exceptional 28.0% |
| Russians | 99.2 /100 | #57 | Exceptional 28.0% |
| Immigrants | Albania | 99.2 /100 | #58 | Exceptional 28.0% |