Belizean vs Immigrants from Ukraine Receiving Food Stamps
COMPARE
Belizean
Immigrants from Ukraine
Receiving Food Stamps
Receiving Food Stamps Comparison
Belizeans
Immigrants from Ukraine
14.8%
RECEIVING FOOD STAMPS
0.1/ 100
METRIC RATING
278th/ 347
METRIC RANK
11.8%
RECEIVING FOOD STAMPS
48.4/ 100
METRIC RATING
177th/ 347
METRIC RANK
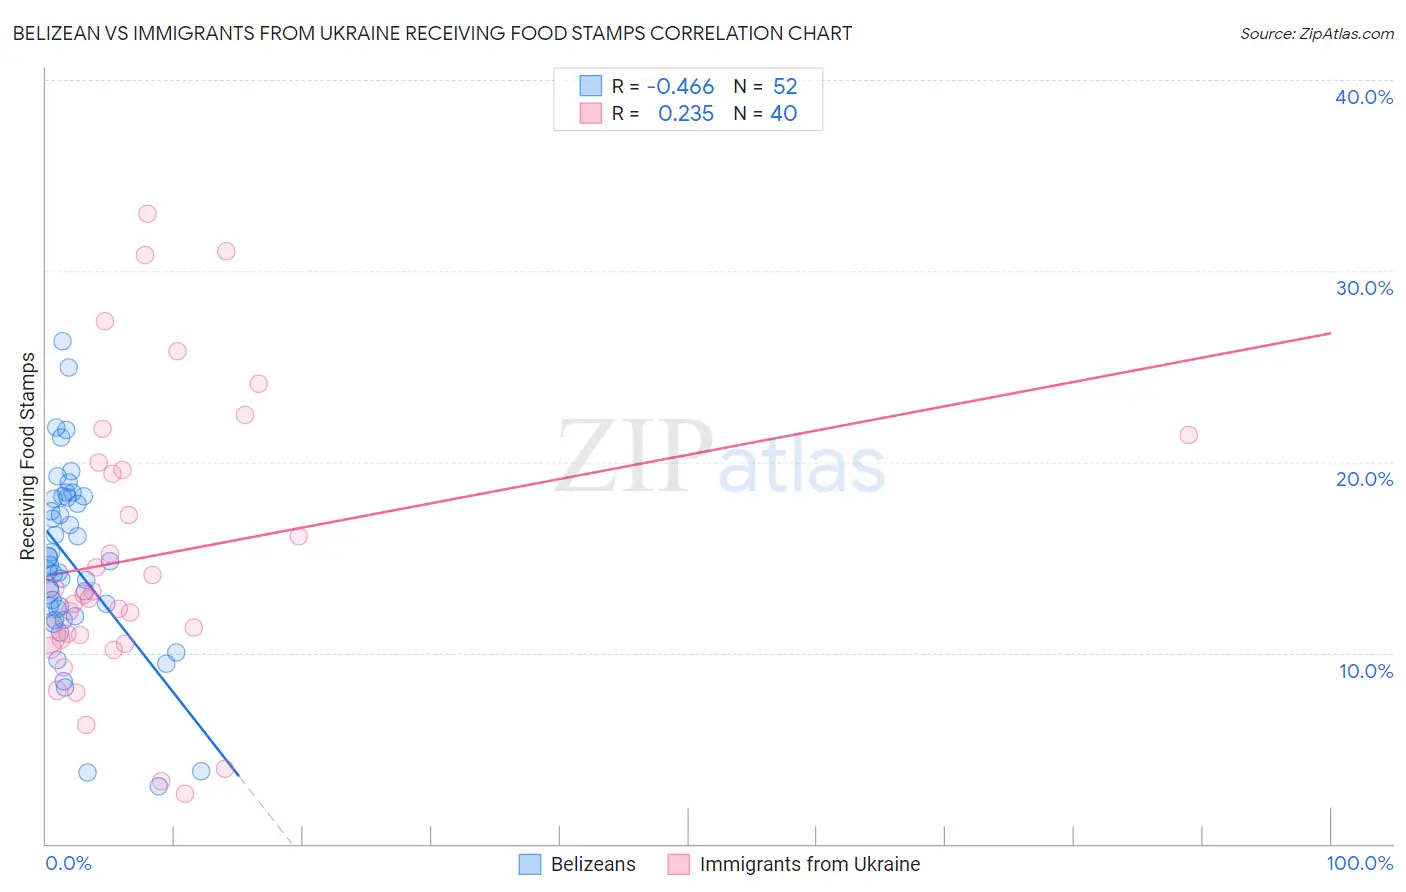
Belizean vs Immigrants from Ukraine Receiving Food Stamps Correlation Chart
The statistical analysis conducted on geographies consisting of 144,020,862 people shows a moderate negative correlation between the proportion of Belizeans and percentage of population receiving government assistance and/or food stamps in the United States with a correlation coefficient (R) of -0.466 and weighted average of 14.8%. Similarly, the statistical analysis conducted on geographies consisting of 288,996,069 people shows a weak positive correlation between the proportion of Immigrants from Ukraine and percentage of population receiving government assistance and/or food stamps in the United States with a correlation coefficient (R) of 0.235 and weighted average of 11.8%, a difference of 26.1%.
Receiving Food Stamps Correlation Summary
| Measurement | Belizean | Immigrants from Ukraine |
| Minimum | 3.0% | 2.6% |
| Maximum | 26.3% | 33.0% |
| Range | 23.3% | 30.4% |
| Mean | 14.7% | 15.1% |
| Median | 14.4% | 12.9% |
| Interquartile 25% (IQ1) | 12.1% | 10.6% |
| Interquartile 75% (IQ3) | 18.1% | 19.8% |
| Interquartile Range (IQR) | 6.0% | 9.2% |
| Standard Deviation (Sample) | 4.8% | 7.5% |
| Standard Deviation (Population) | 4.7% | 7.4% |
Similar Demographics by Receiving Food Stamps
Demographics Similar to Belizeans by Receiving Food Stamps
In terms of receiving food stamps, the demographic groups most similar to Belizeans are Seminole (14.8%, a difference of 0.13%), Liberian (14.8%, a difference of 0.18%), Kiowa (14.9%, a difference of 0.27%), Ecuadorian (14.9%, a difference of 0.32%), and Spanish American Indian (14.9%, a difference of 0.64%).
| Demographics | Rating | Rank | Receiving Food Stamps |
| Immigrants | Guatemala | 0.1 /100 | #271 | Tragic 14.6% |
| Chippewa | 0.1 /100 | #272 | Tragic 14.7% |
| Alaskan Athabascans | 0.1 /100 | #273 | Tragic 14.7% |
| Immigrants | Western Africa | 0.1 /100 | #274 | Tragic 14.7% |
| Ute | 0.1 /100 | #275 | Tragic 14.7% |
| Liberians | 0.1 /100 | #276 | Tragic 14.8% |
| Seminole | 0.1 /100 | #277 | Tragic 14.8% |
| Belizeans | 0.1 /100 | #278 | Tragic 14.8% |
| Kiowa | 0.0 /100 | #279 | Tragic 14.9% |
| Ecuadorians | 0.0 /100 | #280 | Tragic 14.9% |
| Spanish American Indians | 0.0 /100 | #281 | Tragic 14.9% |
| Immigrants | Central America | 0.0 /100 | #282 | Tragic 15.0% |
| Bangladeshis | 0.0 /100 | #283 | Tragic 15.0% |
| Immigrants | Ecuador | 0.0 /100 | #284 | Tragic 15.0% |
| Immigrants | Liberia | 0.0 /100 | #285 | Tragic 15.1% |
Demographics Similar to Immigrants from Ukraine by Receiving Food Stamps
In terms of receiving food stamps, the demographic groups most similar to Immigrants from Ukraine are German Russian (11.8%, a difference of 0.040%), Peruvian (11.7%, a difference of 0.13%), Osage (11.7%, a difference of 0.21%), Immigrants from Eritrea (11.7%, a difference of 0.23%), and Immigrants from Kenya (11.8%, a difference of 0.28%).
| Demographics | Rating | Rank | Receiving Food Stamps |
| Costa Ricans | 57.9 /100 | #170 | Average 11.6% |
| Immigrants | Western Asia | 56.4 /100 | #171 | Average 11.6% |
| Guamanians/Chamorros | 54.2 /100 | #172 | Average 11.7% |
| Immigrants | Syria | 53.4 /100 | #173 | Average 11.7% |
| Immigrants | Eritrea | 50.0 /100 | #174 | Average 11.7% |
| Osage | 49.8 /100 | #175 | Average 11.7% |
| Peruvians | 49.3 /100 | #176 | Average 11.7% |
| Immigrants | Ukraine | 48.4 /100 | #177 | Average 11.8% |
| German Russians | 48.1 /100 | #178 | Average 11.8% |
| Immigrants | Kenya | 46.4 /100 | #179 | Average 11.8% |
| Uruguayans | 44.8 /100 | #180 | Average 11.8% |
| South American Indians | 41.7 /100 | #181 | Average 11.9% |
| Immigrants | Morocco | 40.7 /100 | #182 | Average 11.9% |
| Immigrants | Uganda | 40.3 /100 | #183 | Average 11.9% |
| Spaniards | 39.8 /100 | #184 | Fair 11.9% |