Belizean vs Immigrants from Ukraine Child Poverty Among Girls Under 16
COMPARE
Belizean
Immigrants from Ukraine
Child Poverty Among Girls Under 16
Child Poverty Among Girls Under 16 Comparison
Belizeans
Immigrants from Ukraine
20.2%
CHILD POVERTY AMONG GIRLS UNDER 16
0.0/ 100
METRIC RATING
277th/ 347
METRIC RANK
15.1%
CHILD POVERTY AMONG GIRLS UNDER 16
95.0/ 100
METRIC RATING
107th/ 347
METRIC RANK
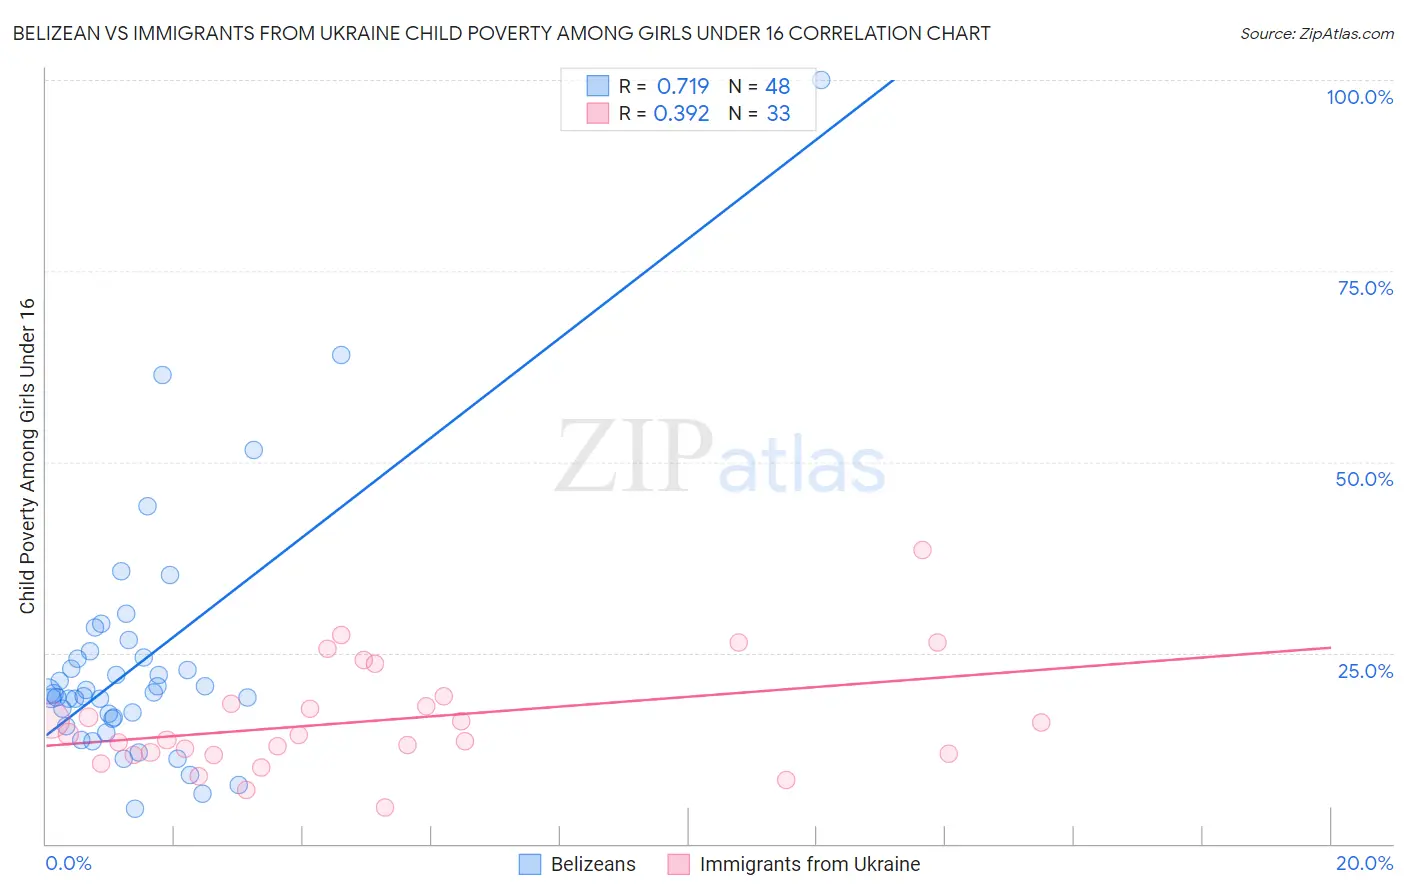
Belizean vs Immigrants from Ukraine Child Poverty Among Girls Under 16 Correlation Chart
The statistical analysis conducted on geographies consisting of 143,559,889 people shows a strong positive correlation between the proportion of Belizeans and poverty level among girls under the age of 16 in the United States with a correlation coefficient (R) of 0.719 and weighted average of 20.2%. Similarly, the statistical analysis conducted on geographies consisting of 284,790,149 people shows a mild positive correlation between the proportion of Immigrants from Ukraine and poverty level among girls under the age of 16 in the United States with a correlation coefficient (R) of 0.392 and weighted average of 15.1%, a difference of 34.0%.
Child Poverty Among Girls Under 16 Correlation Summary
| Measurement | Belizean | Immigrants from Ukraine |
| Minimum | 4.6% | 4.7% |
| Maximum | 100.0% | 38.5% |
| Range | 95.4% | 33.8% |
| Mean | 23.9% | 16.1% |
| Median | 19.7% | 14.2% |
| Interquartile 25% (IQ1) | 16.5% | 11.7% |
| Interquartile 75% (IQ3) | 24.8% | 18.9% |
| Interquartile Range (IQR) | 8.3% | 7.2% |
| Standard Deviation (Sample) | 16.5% | 7.1% |
| Standard Deviation (Population) | 16.4% | 7.0% |
Similar Demographics by Child Poverty Among Girls Under 16
Demographics Similar to Belizeans by Child Poverty Among Girls Under 16
In terms of child poverty among girls under 16, the demographic groups most similar to Belizeans are Barbadian (20.2%, a difference of 0.030%), Comanche (20.2%, a difference of 0.11%), Immigrants from Zaire (20.2%, a difference of 0.16%), Immigrants from Liberia (20.2%, a difference of 0.17%), and Central American (20.2%, a difference of 0.24%).
| Demographics | Rating | Rank | Child Poverty Among Girls Under 16 |
| Cherokee | 0.1 /100 | #270 | Tragic 19.9% |
| Immigrants | Barbados | 0.1 /100 | #271 | Tragic 19.9% |
| Immigrants | El Salvador | 0.1 /100 | #272 | Tragic 20.0% |
| Bangladeshis | 0.1 /100 | #273 | Tragic 20.0% |
| Immigrants | St. Vincent and the Grenadines | 0.0 /100 | #274 | Tragic 20.1% |
| Sub-Saharan Africans | 0.0 /100 | #275 | Tragic 20.1% |
| Comanche | 0.0 /100 | #276 | Tragic 20.2% |
| Belizeans | 0.0 /100 | #277 | Tragic 20.2% |
| Barbadians | 0.0 /100 | #278 | Tragic 20.2% |
| Immigrants | Zaire | 0.0 /100 | #279 | Tragic 20.2% |
| Immigrants | Liberia | 0.0 /100 | #280 | Tragic 20.2% |
| Central Americans | 0.0 /100 | #281 | Tragic 20.2% |
| West Indians | 0.0 /100 | #282 | Tragic 20.3% |
| Senegalese | 0.0 /100 | #283 | Tragic 20.3% |
| Yaqui | 0.0 /100 | #284 | Tragic 20.3% |
Demographics Similar to Immigrants from Ukraine by Child Poverty Among Girls Under 16
In terms of child poverty among girls under 16, the demographic groups most similar to Immigrants from Ukraine are Chilean (15.1%, a difference of 0.060%), Immigrants from England (15.1%, a difference of 0.070%), Immigrants from Brazil (15.1%, a difference of 0.070%), Serbian (15.1%, a difference of 0.16%), and Romanian (15.0%, a difference of 0.22%).
| Demographics | Rating | Rank | Child Poverty Among Girls Under 16 |
| Paraguayans | 95.7 /100 | #100 | Exceptional 15.0% |
| Immigrants | South Africa | 95.6 /100 | #101 | Exceptional 15.0% |
| Immigrants | Malaysia | 95.6 /100 | #102 | Exceptional 15.0% |
| British | 95.6 /100 | #103 | Exceptional 15.0% |
| Romanians | 95.3 /100 | #104 | Exceptional 15.0% |
| Immigrants | England | 95.1 /100 | #105 | Exceptional 15.1% |
| Chileans | 95.1 /100 | #106 | Exceptional 15.1% |
| Immigrants | Ukraine | 95.0 /100 | #107 | Exceptional 15.1% |
| Immigrants | Brazil | 94.9 /100 | #108 | Exceptional 15.1% |
| Serbians | 94.8 /100 | #109 | Exceptional 15.1% |
| Immigrants | Croatia | 94.6 /100 | #110 | Exceptional 15.1% |
| Palestinians | 94.5 /100 | #111 | Exceptional 15.1% |
| Immigrants | Kazakhstan | 94.3 /100 | #112 | Exceptional 15.1% |
| Dutch | 94.3 /100 | #113 | Exceptional 15.1% |
| Sri Lankans | 94.0 /100 | #114 | Exceptional 15.2% |