Peruvian vs Immigrants from Ukraine Single Father Households
COMPARE
Peruvian
Immigrants from Ukraine
Single Father Households
Single Father Households Comparison
Peruvians
Immigrants from Ukraine
2.4%
SINGLE FATHER HOUSEHOLDS
27.1/ 100
METRIC RATING
200th/ 347
METRIC RANK
2.0%
SINGLE FATHER HOUSEHOLDS
99.9/ 100
METRIC RATING
47th/ 347
METRIC RANK
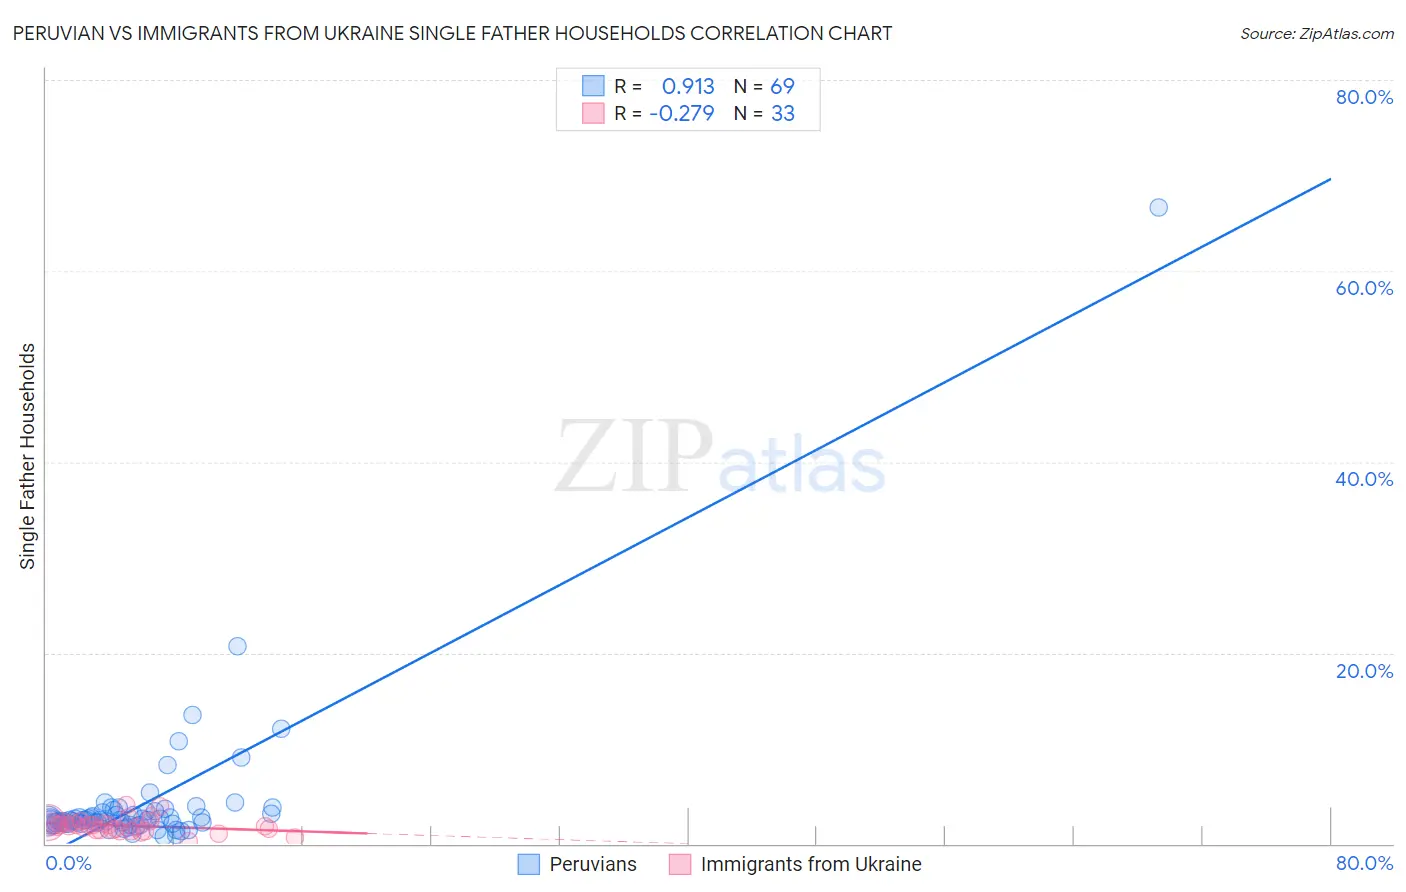
Peruvian vs Immigrants from Ukraine Single Father Households Correlation Chart
The statistical analysis conducted on geographies consisting of 360,687,122 people shows a near-perfect positive correlation between the proportion of Peruvians and percentage of single father households in the United States with a correlation coefficient (R) of 0.913 and weighted average of 2.4%. Similarly, the statistical analysis conducted on geographies consisting of 287,847,219 people shows a weak negative correlation between the proportion of Immigrants from Ukraine and percentage of single father households in the United States with a correlation coefficient (R) of -0.279 and weighted average of 2.0%, a difference of 18.1%.
Single Father Households Correlation Summary
| Measurement | Peruvian | Immigrants from Ukraine |
| Minimum | 0.80% | 0.28% |
| Maximum | 66.7% | 4.1% |
| Range | 65.9% | 3.8% |
| Mean | 4.3% | 1.9% |
| Median | 2.5% | 1.9% |
| Interquartile 25% (IQ1) | 2.2% | 1.5% |
| Interquartile 75% (IQ3) | 3.4% | 2.2% |
| Interquartile Range (IQR) | 1.2% | 0.77% |
| Standard Deviation (Sample) | 8.2% | 0.76% |
| Standard Deviation (Population) | 8.2% | 0.74% |
Similar Demographics by Single Father Households
Demographics Similar to Peruvians by Single Father Households
In terms of single father households, the demographic groups most similar to Peruvians are Immigrants from Vietnam (2.4%, a difference of 0.0%), Scandinavian (2.4%, a difference of 0.030%), German (2.4%, a difference of 0.080%), Kenyan (2.4%, a difference of 0.090%), and Immigrants from Uganda (2.4%, a difference of 0.10%).
| Demographics | Rating | Rank | Single Father Households |
| Uruguayans | 29.7 /100 | #193 | Fair 2.4% |
| Panamanians | 29.6 /100 | #194 | Fair 2.4% |
| Immigrants | Philippines | 28.7 /100 | #195 | Fair 2.4% |
| Kenyans | 28.0 /100 | #196 | Fair 2.4% |
| Germans | 28.0 /100 | #197 | Fair 2.4% |
| Scandinavians | 27.4 /100 | #198 | Fair 2.4% |
| Immigrants | Vietnam | 27.1 /100 | #199 | Fair 2.4% |
| Peruvians | 27.1 /100 | #200 | Fair 2.4% |
| Immigrants | Uganda | 26.0 /100 | #201 | Fair 2.4% |
| German Russians | 25.7 /100 | #202 | Fair 2.4% |
| French Canadians | 24.7 /100 | #203 | Fair 2.4% |
| Ecuadorians | 24.5 /100 | #204 | Fair 2.4% |
| Immigrants | Afghanistan | 24.2 /100 | #205 | Fair 2.4% |
| Koreans | 24.1 /100 | #206 | Fair 2.4% |
| Whites/Caucasians | 22.6 /100 | #207 | Fair 2.4% |
Demographics Similar to Immigrants from Ukraine by Single Father Households
In terms of single father households, the demographic groups most similar to Immigrants from Ukraine are Immigrants from Kazakhstan (2.0%, a difference of 0.020%), Immigrants from Serbia (2.0%, a difference of 0.030%), Immigrants from Switzerland (2.0%, a difference of 0.040%), Immigrants from Poland (2.0%, a difference of 0.040%), and Immigrants from Europe (2.0%, a difference of 0.28%).
| Demographics | Rating | Rank | Single Father Households |
| Immigrants | Bulgaria | 100.0 /100 | #40 | Exceptional 2.0% |
| Immigrants | Turkey | 100.0 /100 | #41 | Exceptional 2.0% |
| Macedonians | 100.0 /100 | #42 | Exceptional 2.0% |
| Immigrants | Grenada | 100.0 /100 | #43 | Exceptional 2.0% |
| Latvians | 100.0 /100 | #44 | Exceptional 2.0% |
| Russians | 100.0 /100 | #45 | Exceptional 2.0% |
| Immigrants | Lebanon | 100.0 /100 | #46 | Exceptional 2.0% |
| Immigrants | Ukraine | 99.9 /100 | #47 | Exceptional 2.0% |
| Immigrants | Kazakhstan | 99.9 /100 | #48 | Exceptional 2.0% |
| Immigrants | Serbia | 99.9 /100 | #49 | Exceptional 2.0% |
| Immigrants | Switzerland | 99.9 /100 | #50 | Exceptional 2.0% |
| Immigrants | Poland | 99.9 /100 | #51 | Exceptional 2.0% |
| Immigrants | Europe | 99.9 /100 | #52 | Exceptional 2.0% |
| Immigrants | Northern Europe | 99.9 /100 | #53 | Exceptional 2.0% |
| Immigrants | Korea | 99.9 /100 | #54 | Exceptional 2.0% |