Belizean vs Immigrants from Serbia Professional Degree
COMPARE
Belizean
Immigrants from Serbia
Professional Degree
Professional Degree Comparison
Belizeans
Immigrants from Serbia
3.6%
PROFESSIONAL DEGREE
0.5/ 100
METRIC RATING
271st/ 347
METRIC RANK
5.8%
PROFESSIONAL DEGREE
100.0/ 100
METRIC RATING
52nd/ 347
METRIC RANK
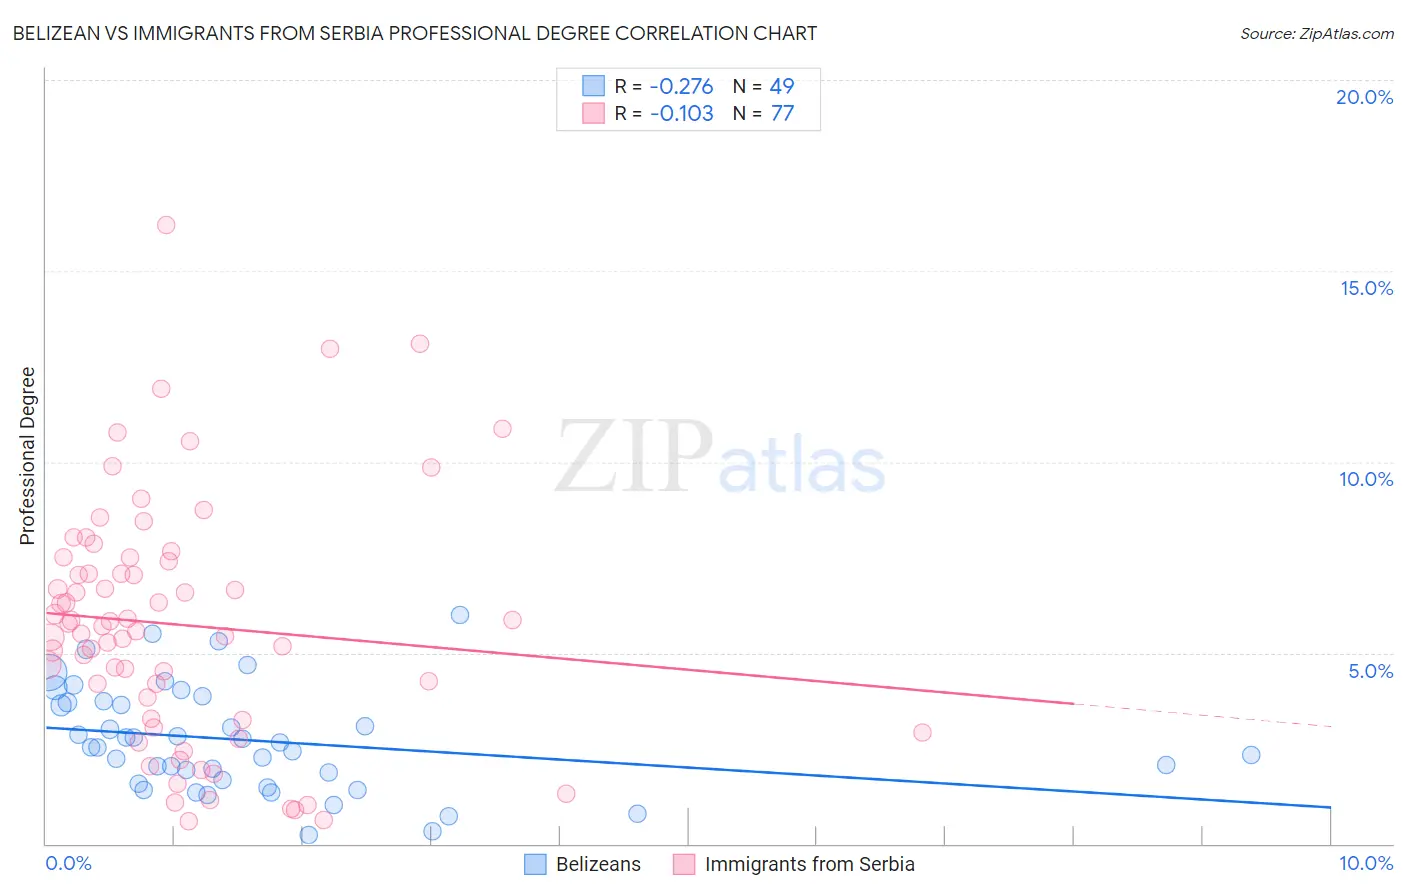
Belizean vs Immigrants from Serbia Professional Degree Correlation Chart
The statistical analysis conducted on geographies consisting of 144,093,720 people shows a weak negative correlation between the proportion of Belizeans and percentage of population with at least professional degree education in the United States with a correlation coefficient (R) of -0.276 and weighted average of 3.6%. Similarly, the statistical analysis conducted on geographies consisting of 131,711,422 people shows a poor negative correlation between the proportion of Immigrants from Serbia and percentage of population with at least professional degree education in the United States with a correlation coefficient (R) of -0.103 and weighted average of 5.8%, a difference of 62.9%.
Professional Degree Correlation Summary
| Measurement | Belizean | Immigrants from Serbia |
| Minimum | 0.21% | 0.58% |
| Maximum | 6.0% | 16.2% |
| Range | 5.8% | 15.6% |
| Mean | 2.7% | 5.7% |
| Median | 2.5% | 5.7% |
| Interquartile 25% (IQ1) | 1.6% | 3.3% |
| Interquartile 75% (IQ3) | 3.7% | 7.5% |
| Interquartile Range (IQR) | 2.1% | 4.2% |
| Standard Deviation (Sample) | 1.4% | 3.2% |
| Standard Deviation (Population) | 1.4% | 3.2% |
Similar Demographics by Professional Degree
Demographics Similar to Belizeans by Professional Degree
In terms of professional degree, the demographic groups most similar to Belizeans are Immigrants from Jamaica (3.6%, a difference of 0.030%), American (3.6%, a difference of 0.090%), Potawatomi (3.6%, a difference of 0.22%), Immigrants from Dominica (3.6%, a difference of 0.45%), and Central American (3.6%, a difference of 0.47%).
| Demographics | Rating | Rank | Professional Degree |
| Immigrants | Cambodia | 0.9 /100 | #264 | Tragic 3.6% |
| Immigrants | Congo | 0.8 /100 | #265 | Tragic 3.6% |
| Central American Indians | 0.8 /100 | #266 | Tragic 3.6% |
| Delaware | 0.7 /100 | #267 | Tragic 3.6% |
| Aleuts | 0.7 /100 | #268 | Tragic 3.6% |
| Immigrants | Cuba | 0.6 /100 | #269 | Tragic 3.6% |
| Central Americans | 0.6 /100 | #270 | Tragic 3.6% |
| Belizeans | 0.5 /100 | #271 | Tragic 3.6% |
| Immigrants | Jamaica | 0.5 /100 | #272 | Tragic 3.6% |
| Americans | 0.5 /100 | #273 | Tragic 3.6% |
| Potawatomi | 0.5 /100 | #274 | Tragic 3.6% |
| Immigrants | Dominica | 0.5 /100 | #275 | Tragic 3.6% |
| Liberians | 0.5 /100 | #276 | Tragic 3.6% |
| Cheyenne | 0.5 /100 | #277 | Tragic 3.6% |
| Japanese | 0.5 /100 | #278 | Tragic 3.5% |
Demographics Similar to Immigrants from Serbia by Professional Degree
In terms of professional degree, the demographic groups most similar to Immigrants from Serbia are Immigrants from Greece (5.8%, a difference of 0.070%), Immigrants from Czechoslovakia (5.8%, a difference of 0.13%), Immigrants from Netherlands (5.8%, a difference of 0.23%), Immigrants from Latvia (5.8%, a difference of 0.45%), and Paraguayan (5.9%, a difference of 0.86%).
| Demographics | Rating | Rank | Professional Degree |
| Immigrants | South Central Asia | 100.0 /100 | #45 | Exceptional 5.9% |
| Immigrants | Argentina | 100.0 /100 | #46 | Exceptional 5.9% |
| Australians | 100.0 /100 | #47 | Exceptional 5.9% |
| Paraguayans | 100.0 /100 | #48 | Exceptional 5.9% |
| Immigrants | Latvia | 100.0 /100 | #49 | Exceptional 5.8% |
| Immigrants | Czechoslovakia | 100.0 /100 | #50 | Exceptional 5.8% |
| Immigrants | Greece | 100.0 /100 | #51 | Exceptional 5.8% |
| Immigrants | Serbia | 100.0 /100 | #52 | Exceptional 5.8% |
| Immigrants | Netherlands | 100.0 /100 | #53 | Exceptional 5.8% |
| Immigrants | Kuwait | 100.0 /100 | #54 | Exceptional 5.7% |
| Immigrants | Western Europe | 100.0 /100 | #55 | Exceptional 5.7% |
| Immigrants | Malaysia | 100.0 /100 | #56 | Exceptional 5.7% |
| South Africans | 100.0 /100 | #57 | Exceptional 5.7% |
| Bulgarians | 100.0 /100 | #58 | Exceptional 5.7% |
| Immigrants | Europe | 100.0 /100 | #59 | Exceptional 5.6% |