Belizean vs Immigrants from Serbia Disability Age Over 75
COMPARE
Belizean
Immigrants from Serbia
Disability Age Over 75
Disability Age Over 75 Comparison
Belizeans
Immigrants from Serbia
49.4%
DISABILITY AGE OVER 75
0.0/ 100
METRIC RATING
281st/ 347
METRIC RANK
45.3%
DISABILITY AGE OVER 75
100.0/ 100
METRIC RATING
20th/ 347
METRIC RANK
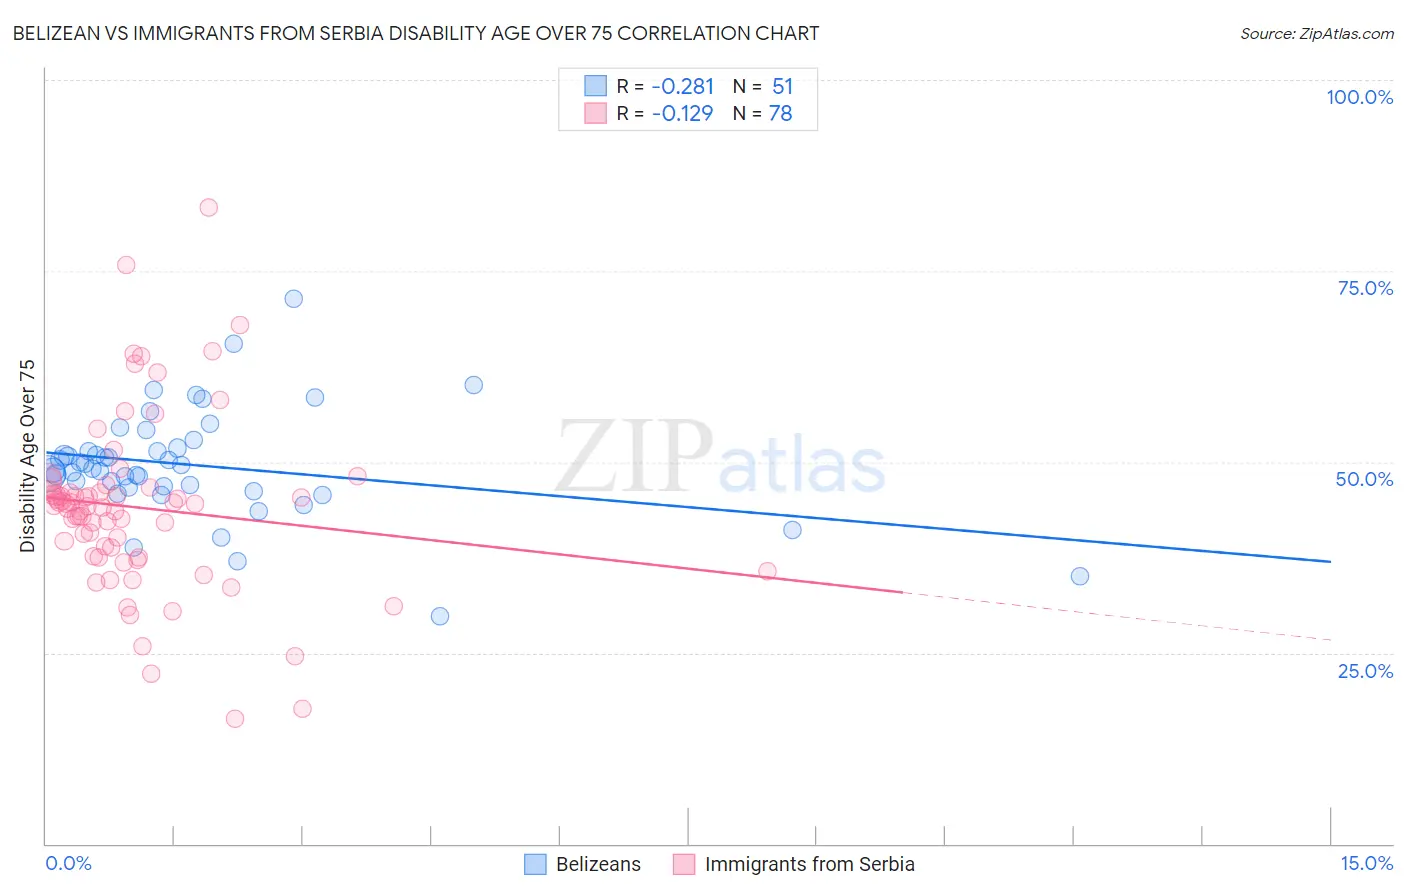
Belizean vs Immigrants from Serbia Disability Age Over 75 Correlation Chart
The statistical analysis conducted on geographies consisting of 144,100,145 people shows a weak negative correlation between the proportion of Belizeans and percentage of population with a disability over the age of 75 in the United States with a correlation coefficient (R) of -0.281 and weighted average of 49.4%. Similarly, the statistical analysis conducted on geographies consisting of 131,709,853 people shows a poor negative correlation between the proportion of Immigrants from Serbia and percentage of population with a disability over the age of 75 in the United States with a correlation coefficient (R) of -0.129 and weighted average of 45.3%, a difference of 9.2%.
Disability Age Over 75 Correlation Summary
| Measurement | Belizean | Immigrants from Serbia |
| Minimum | 29.7% | 16.3% |
| Maximum | 71.4% | 83.3% |
| Range | 41.7% | 67.0% |
| Mean | 49.6% | 44.0% |
| Median | 49.1% | 44.2% |
| Interquartile 25% (IQ1) | 46.7% | 37.6% |
| Interquartile 75% (IQ3) | 51.8% | 46.2% |
| Interquartile Range (IQR) | 5.1% | 8.6% |
| Standard Deviation (Sample) | 7.1% | 11.4% |
| Standard Deviation (Population) | 7.0% | 11.4% |
Similar Demographics by Disability Age Over 75
Demographics Similar to Belizeans by Disability Age Over 75
In terms of disability age over 75, the demographic groups most similar to Belizeans are Bangladeshi (49.4%, a difference of 0.0%), Guamanian/Chamorro (49.4%, a difference of 0.070%), Black/African American (49.5%, a difference of 0.14%), Samoan (49.5%, a difference of 0.17%), and Immigrants from Latin America (49.5%, a difference of 0.22%).
| Demographics | Rating | Rank | Disability Age Over 75 |
| Immigrants | Guatemala | 0.1 /100 | #274 | Tragic 49.1% |
| Immigrants | Dominica | 0.1 /100 | #275 | Tragic 49.1% |
| Immigrants | Uzbekistan | 0.1 /100 | #276 | Tragic 49.2% |
| Hawaiians | 0.1 /100 | #277 | Tragic 49.2% |
| Immigrants | Laos | 0.1 /100 | #278 | Tragic 49.2% |
| Guamanians/Chamorros | 0.0 /100 | #279 | Tragic 49.4% |
| Bangladeshis | 0.0 /100 | #280 | Tragic 49.4% |
| Belizeans | 0.0 /100 | #281 | Tragic 49.4% |
| Blacks/African Americans | 0.0 /100 | #282 | Tragic 49.5% |
| Samoans | 0.0 /100 | #283 | Tragic 49.5% |
| Immigrants | Latin America | 0.0 /100 | #284 | Tragic 49.5% |
| Crow | 0.0 /100 | #285 | Tragic 49.6% |
| Immigrants | Belize | 0.0 /100 | #286 | Tragic 49.6% |
| Sioux | 0.0 /100 | #287 | Tragic 49.7% |
| Yaqui | 0.0 /100 | #288 | Tragic 49.8% |
Demographics Similar to Immigrants from Serbia by Disability Age Over 75
In terms of disability age over 75, the demographic groups most similar to Immigrants from Serbia are Bolivian (45.2%, a difference of 0.11%), Immigrants from Greece (45.2%, a difference of 0.11%), Immigrants from Belgium (45.3%, a difference of 0.13%), Immigrants from India (45.2%, a difference of 0.14%), and Immigrants from Northern Europe (45.2%, a difference of 0.15%).
| Demographics | Rating | Rank | Disability Age Over 75 |
| Latvians | 100.0 /100 | #13 | Exceptional 45.1% |
| Immigrants | Scotland | 100.0 /100 | #14 | Exceptional 45.1% |
| Immigrants | Sweden | 100.0 /100 | #15 | Exceptional 45.1% |
| Immigrants | Northern Europe | 100.0 /100 | #16 | Exceptional 45.2% |
| Immigrants | India | 100.0 /100 | #17 | Exceptional 45.2% |
| Bolivians | 100.0 /100 | #18 | Exceptional 45.2% |
| Immigrants | Greece | 100.0 /100 | #19 | Exceptional 45.2% |
| Immigrants | Serbia | 100.0 /100 | #20 | Exceptional 45.3% |
| Immigrants | Belgium | 100.0 /100 | #21 | Exceptional 45.3% |
| Immigrants | South Africa | 100.0 /100 | #22 | Exceptional 45.3% |
| Immigrants | Switzerland | 99.9 /100 | #23 | Exceptional 45.3% |
| Poles | 99.9 /100 | #24 | Exceptional 45.3% |
| Immigrants | Bolivia | 99.9 /100 | #25 | Exceptional 45.4% |
| Macedonians | 99.9 /100 | #26 | Exceptional 45.4% |
| Immigrants | Poland | 99.9 /100 | #27 | Exceptional 45.4% |