Belizean vs Immigrants from Serbia Householder Income Under 25 years
COMPARE
Belizean
Immigrants from Serbia
Householder Income Under 25 years
Householder Income Under 25 years Comparison
Belizeans
Immigrants from Serbia
$51,094
HOUSEHOLDER INCOME UNDER 25 YEARS
6.4/ 100
METRIC RATING
224th/ 347
METRIC RANK
$53,321
HOUSEHOLDER INCOME UNDER 25 YEARS
94.1/ 100
METRIC RATING
126th/ 347
METRIC RANK
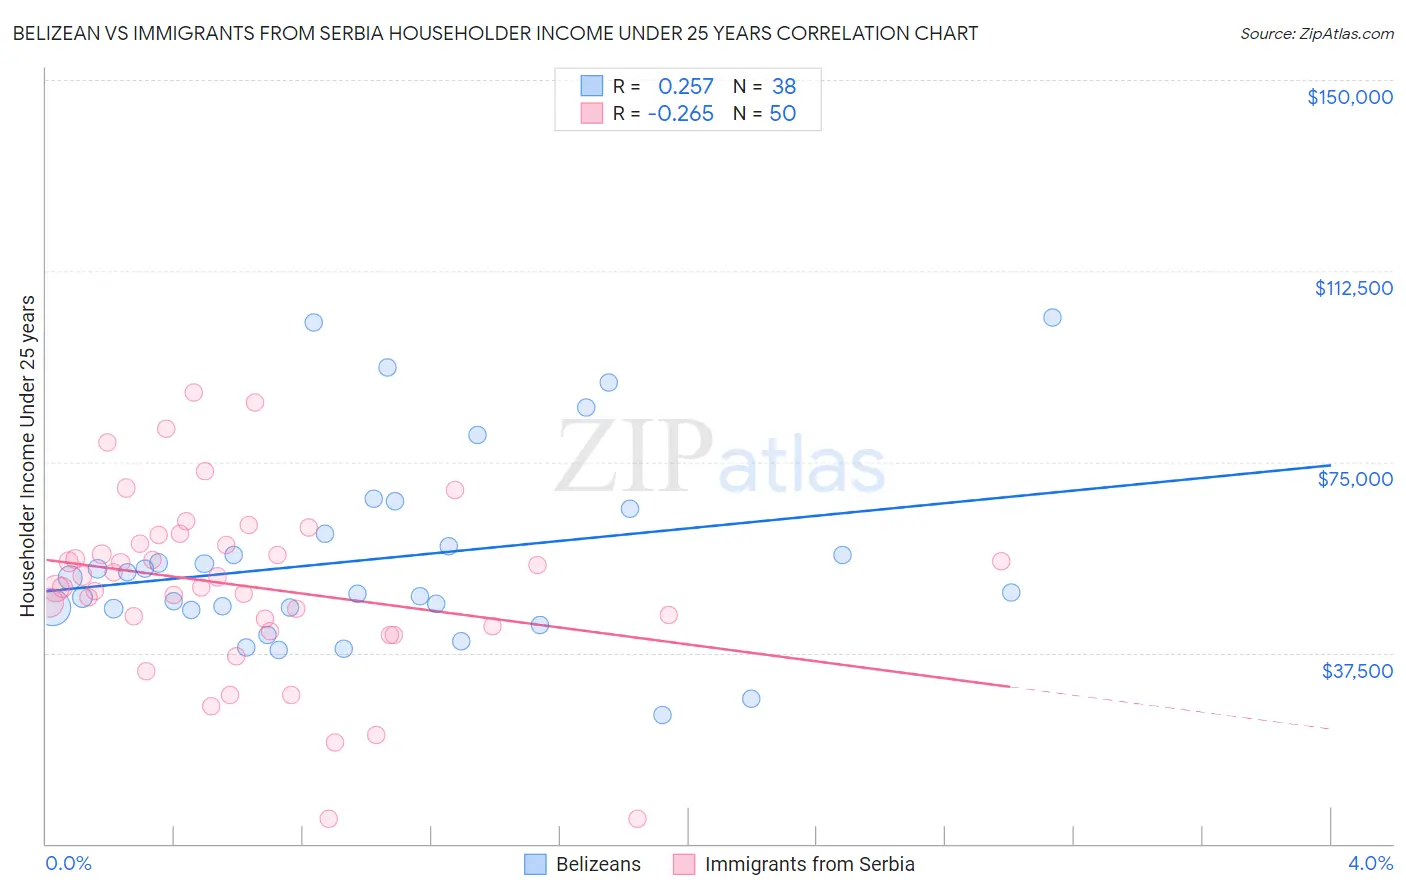
Belizean vs Immigrants from Serbia Householder Income Under 25 years Correlation Chart
The statistical analysis conducted on geographies consisting of 132,883,097 people shows a weak positive correlation between the proportion of Belizeans and household income with householder under the age of 25 in the United States with a correlation coefficient (R) of 0.257 and weighted average of $51,094. Similarly, the statistical analysis conducted on geographies consisting of 120,272,862 people shows a weak negative correlation between the proportion of Immigrants from Serbia and household income with householder under the age of 25 in the United States with a correlation coefficient (R) of -0.265 and weighted average of $53,321, a difference of 4.4%.
Householder Income Under 25 years Correlation Summary
| Measurement | Belizean | Immigrants from Serbia |
| Minimum | $25,260 | $4,881 |
| Maximum | $103,333 | $88,661 |
| Range | $78,073 | $83,780 |
| Mean | $55,975 | $50,549 |
| Median | $50,853 | $51,356 |
| Interquartile 25% (IQ1) | $46,192 | $42,708 |
| Interquartile 75% (IQ3) | $60,909 | $58,831 |
| Interquartile Range (IQR) | $14,716 | $16,123 |
| Standard Deviation (Sample) | $18,766 | $17,589 |
| Standard Deviation (Population) | $18,517 | $17,412 |
Similar Demographics by Householder Income Under 25 years
Demographics Similar to Belizeans by Householder Income Under 25 years
In terms of householder income under 25 years, the demographic groups most similar to Belizeans are Serbian ($51,106, a difference of 0.020%), Spaniard ($51,117, a difference of 0.050%), Immigrants from Jamaica ($51,038, a difference of 0.11%), Immigrants from Eastern Africa ($51,158, a difference of 0.13%), and Yugoslavian ($51,028, a difference of 0.13%).
| Demographics | Rating | Rank | Householder Income Under 25 years |
| Czechoslovakians | 8.6 /100 | #217 | Tragic $51,224 |
| Immigrants | Belize | 8.6 /100 | #218 | Tragic $51,223 |
| Arabs | 8.5 /100 | #219 | Tragic $51,219 |
| Immigrants | Germany | 8.0 /100 | #220 | Tragic $51,190 |
| Immigrants | Eastern Africa | 7.4 /100 | #221 | Tragic $51,158 |
| Spaniards | 6.8 /100 | #222 | Tragic $51,117 |
| Serbians | 6.6 /100 | #223 | Tragic $51,106 |
| Belizeans | 6.4 /100 | #224 | Tragic $51,094 |
| Immigrants | Jamaica | 5.6 /100 | #225 | Tragic $51,038 |
| Yugoslavians | 5.5 /100 | #226 | Tragic $51,028 |
| Immigrants | Central America | 5.4 /100 | #227 | Tragic $51,022 |
| Immigrants | Norway | 5.0 /100 | #228 | Tragic $50,984 |
| Yuman | 4.4 /100 | #229 | Tragic $50,933 |
| Jamaicans | 4.4 /100 | #230 | Tragic $50,929 |
| Ugandans | 4.3 /100 | #231 | Tragic $50,923 |
Demographics Similar to Immigrants from Serbia by Householder Income Under 25 years
In terms of householder income under 25 years, the demographic groups most similar to Immigrants from Serbia are Pakistani ($53,325, a difference of 0.010%), Immigrants from North America ($53,307, a difference of 0.030%), Immigrants from Bulgaria ($53,305, a difference of 0.030%), New Zealander ($53,294, a difference of 0.050%), and Colombian ($53,357, a difference of 0.070%).
| Demographics | Rating | Rank | Householder Income Under 25 years |
| Italians | 95.4 /100 | #119 | Exceptional $53,426 |
| Guamanians/Chamorros | 95.3 /100 | #120 | Exceptional $53,423 |
| Immigrants | Canada | 95.2 /100 | #121 | Exceptional $53,411 |
| Immigrants | Ethiopia | 95.2 /100 | #122 | Exceptional $53,408 |
| Immigrants | Iraq | 94.9 /100 | #123 | Exceptional $53,384 |
| Colombians | 94.6 /100 | #124 | Exceptional $53,357 |
| Pakistanis | 94.1 /100 | #125 | Exceptional $53,325 |
| Immigrants | Serbia | 94.1 /100 | #126 | Exceptional $53,321 |
| Immigrants | North America | 93.9 /100 | #127 | Exceptional $53,307 |
| Immigrants | Bulgaria | 93.9 /100 | #128 | Exceptional $53,305 |
| New Zealanders | 93.7 /100 | #129 | Exceptional $53,294 |
| Nicaraguans | 93.4 /100 | #130 | Exceptional $53,275 |
| Immigrants | Nicaragua | 93.3 /100 | #131 | Exceptional $53,266 |
| Moroccans | 93.1 /100 | #132 | Exceptional $53,256 |
| Immigrants | Immigrants | 92.2 /100 | #133 | Exceptional $53,201 |