Belgian vs Maltese Median Earnings
COMPARE
Belgian
Maltese
Median Earnings
Median Earnings Comparison
Belgians
Maltese
$46,375
MEDIAN EARNINGS
48.0/ 100
METRIC RATING
177th/ 347
METRIC RANK
$52,526
MEDIAN EARNINGS
100.0/ 100
METRIC RATING
42nd/ 347
METRIC RANK
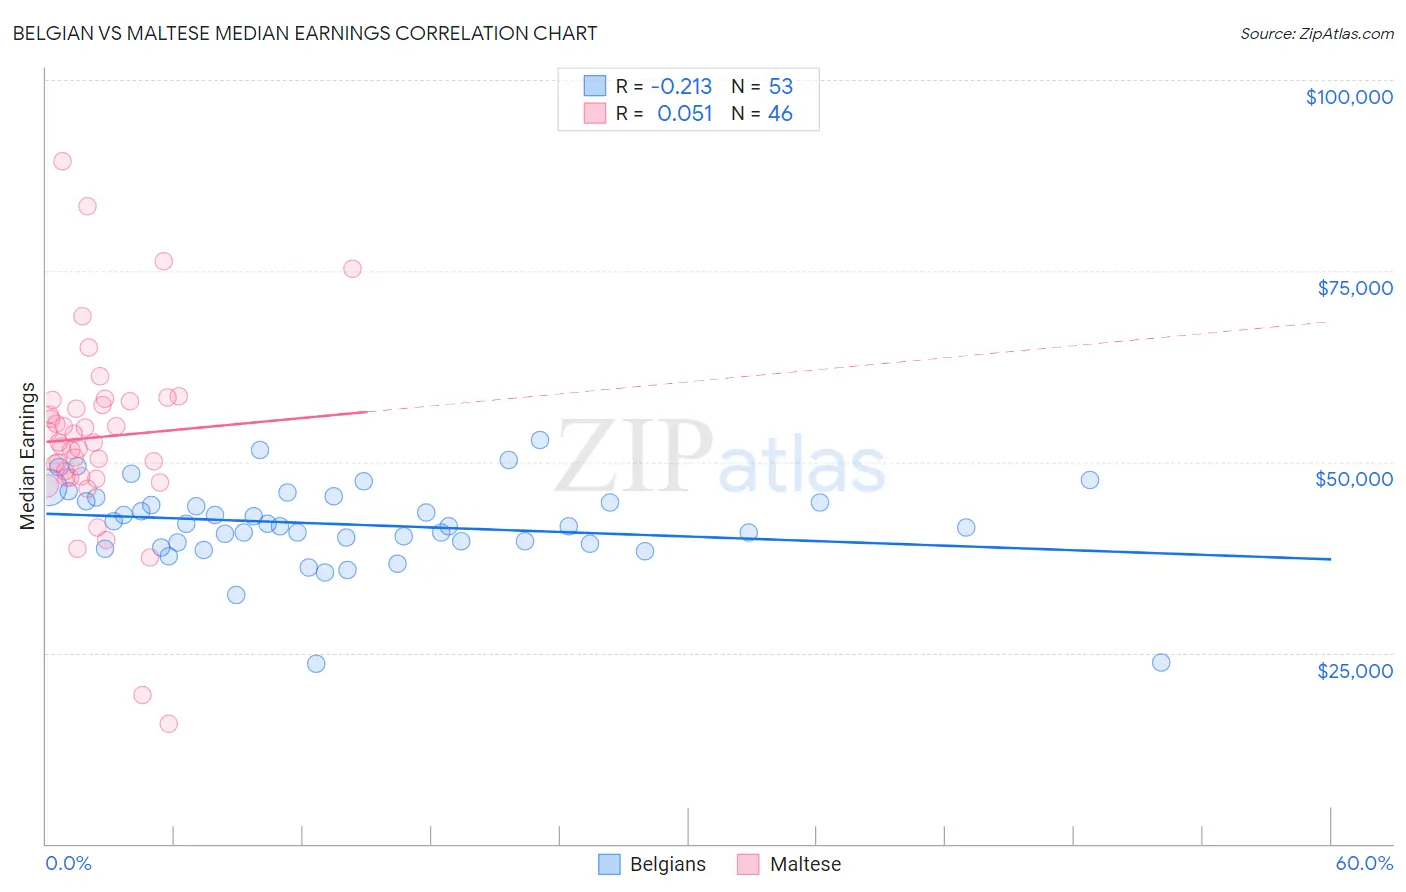
Belgian vs Maltese Median Earnings Correlation Chart
The statistical analysis conducted on geographies consisting of 356,004,504 people shows a weak negative correlation between the proportion of Belgians and median earnings in the United States with a correlation coefficient (R) of -0.213 and weighted average of $46,375. Similarly, the statistical analysis conducted on geographies consisting of 126,475,400 people shows a slight positive correlation between the proportion of Maltese and median earnings in the United States with a correlation coefficient (R) of 0.051 and weighted average of $52,526, a difference of 13.3%.
Median Earnings Correlation Summary
| Measurement | Belgian | Maltese |
| Minimum | $23,500 | $15,781 |
| Maximum | $52,848 | $89,336 |
| Range | $29,348 | $73,555 |
| Mean | $41,793 | $53,240 |
| Median | $41,635 | $52,561 |
| Interquartile 25% (IQ1) | $39,329 | $48,020 |
| Interquartile 75% (IQ3) | $45,075 | $57,908 |
| Interquartile Range (IQR) | $5,747 | $9,888 |
| Standard Deviation (Sample) | $5,579 | $12,910 |
| Standard Deviation (Population) | $5,526 | $12,769 |
Similar Demographics by Median Earnings
Demographics Similar to Belgians by Median Earnings
In terms of median earnings, the demographic groups most similar to Belgians are Danish ($46,392, a difference of 0.040%), Basque ($46,399, a difference of 0.050%), Colombian ($46,349, a difference of 0.060%), English ($46,334, a difference of 0.090%), and Puget Sound Salish ($46,333, a difference of 0.090%).
| Demographics | Rating | Rank | Median Earnings |
| Immigrants | Immigrants | 51.6 /100 | #170 | Average $46,478 |
| Scottish | 51.1 /100 | #171 | Average $46,463 |
| Kenyans | 51.0 /100 | #172 | Average $46,462 |
| Ghanaians | 50.3 /100 | #173 | Average $46,440 |
| Scandinavians | 50.0 /100 | #174 | Average $46,433 |
| Basques | 48.8 /100 | #175 | Average $46,399 |
| Danes | 48.6 /100 | #176 | Average $46,392 |
| Belgians | 48.0 /100 | #177 | Average $46,375 |
| Colombians | 47.1 /100 | #178 | Average $46,349 |
| English | 46.5 /100 | #179 | Average $46,334 |
| Puget Sound Salish | 46.5 /100 | #180 | Average $46,333 |
| Immigrants | Cameroon | 46.4 /100 | #181 | Average $46,329 |
| Swiss | 45.9 /100 | #182 | Average $46,315 |
| French | 45.2 /100 | #183 | Average $46,296 |
| Immigrants | Kenya | 42.4 /100 | #184 | Average $46,214 |
Demographics Similar to Maltese by Median Earnings
In terms of median earnings, the demographic groups most similar to Maltese are Immigrants from Malaysia ($52,514, a difference of 0.020%), Bulgarian ($52,512, a difference of 0.030%), Immigrants from Czechoslovakia ($52,361, a difference of 0.31%), Bhutanese ($52,297, a difference of 0.44%), and Australian ($52,294, a difference of 0.44%).
| Demographics | Rating | Rank | Median Earnings |
| Immigrants | Switzerland | 100.0 /100 | #35 | Exceptional $53,211 |
| Immigrants | Denmark | 100.0 /100 | #36 | Exceptional $53,186 |
| Immigrants | Belarus | 100.0 /100 | #37 | Exceptional $53,043 |
| Latvians | 100.0 /100 | #38 | Exceptional $53,001 |
| Immigrants | Turkey | 100.0 /100 | #39 | Exceptional $52,960 |
| Israelis | 100.0 /100 | #40 | Exceptional $52,937 |
| Immigrants | Lithuania | 100.0 /100 | #41 | Exceptional $52,769 |
| Maltese | 100.0 /100 | #42 | Exceptional $52,526 |
| Immigrants | Malaysia | 100.0 /100 | #43 | Exceptional $52,514 |
| Bulgarians | 100.0 /100 | #44 | Exceptional $52,512 |
| Immigrants | Czechoslovakia | 100.0 /100 | #45 | Exceptional $52,361 |
| Bhutanese | 100.0 /100 | #46 | Exceptional $52,297 |
| Australians | 100.0 /100 | #47 | Exceptional $52,294 |
| Immigrants | Europe | 100.0 /100 | #48 | Exceptional $52,195 |
| Bolivians | 100.0 /100 | #49 | Exceptional $52,005 |