Immigrants from China vs German Family Households
COMPARE
Immigrants from China
German
Family Households
Family Households Comparison
Immigrants from China
Germans
64.7%
FAMILY HOUSEHOLDS
86.6/ 100
METRIC RATING
136th/ 347
METRIC RANK
64.4%
FAMILY HOUSEHOLDS
65.8/ 100
METRIC RATING
159th/ 347
METRIC RANK
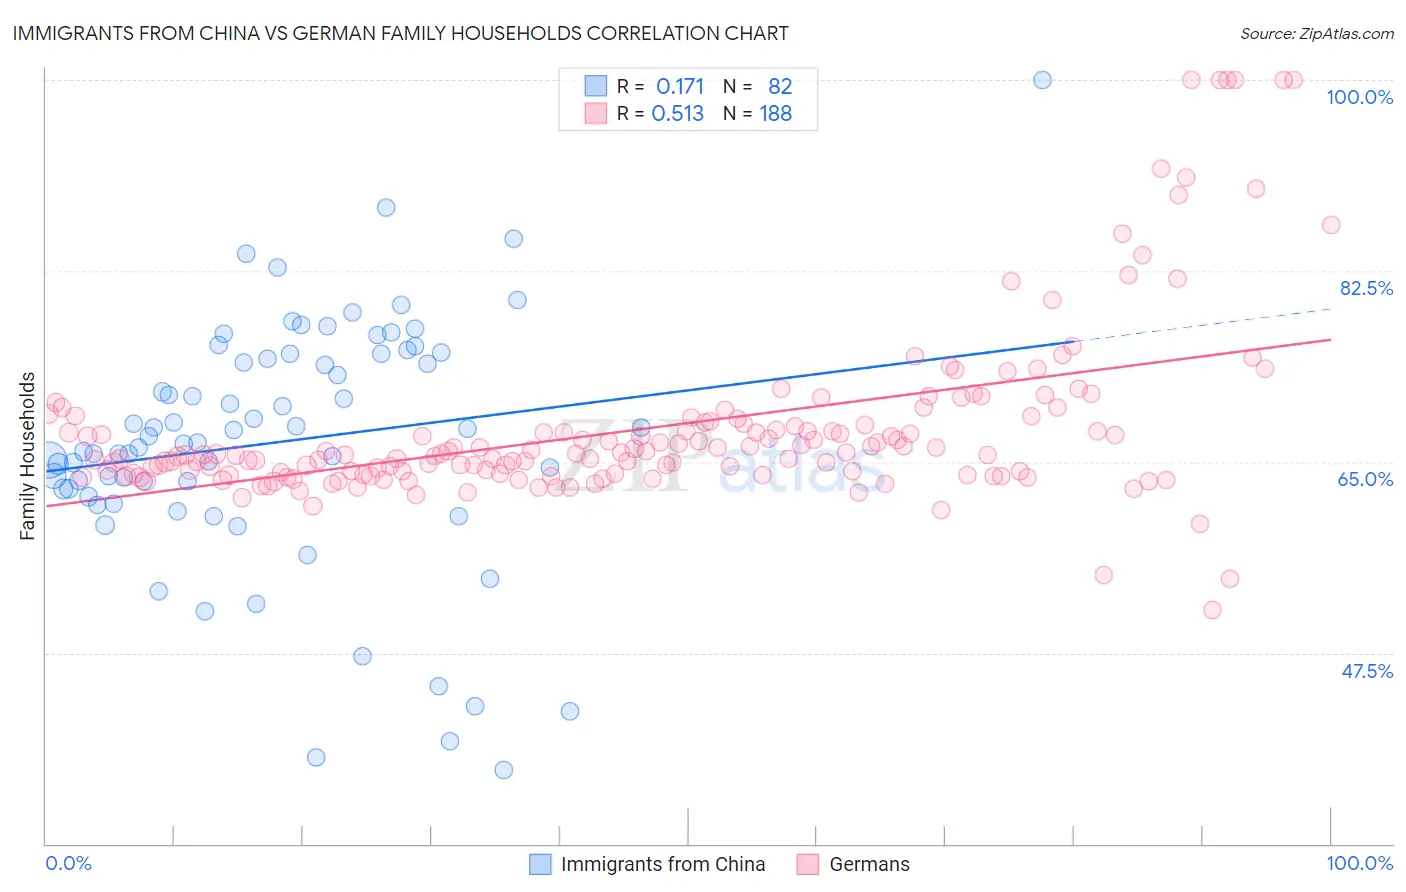
Immigrants from China vs German Family Households Correlation Chart
The statistical analysis conducted on geographies consisting of 456,596,066 people shows a poor positive correlation between the proportion of Immigrants from China and percentage of family households in the United States with a correlation coefficient (R) of 0.171 and weighted average of 64.7%. Similarly, the statistical analysis conducted on geographies consisting of 580,609,417 people shows a substantial positive correlation between the proportion of Germans and percentage of family households in the United States with a correlation coefficient (R) of 0.513 and weighted average of 64.4%, a difference of 0.40%.
Family Households Correlation Summary
| Measurement | Immigrants from China | German |
| Minimum | 36.8% | 51.4% |
| Maximum | 100.0% | 100.0% |
| Range | 63.2% | 48.6% |
| Mean | 66.8% | 68.1% |
| Median | 67.1% | 65.7% |
| Interquartile 25% (IQ1) | 62.5% | 63.9% |
| Interquartile 75% (IQ3) | 74.9% | 68.5% |
| Interquartile Range (IQR) | 12.4% | 4.7% |
| Standard Deviation (Sample) | 11.3% | 8.2% |
| Standard Deviation (Population) | 11.3% | 8.2% |
Similar Demographics by Family Households
Demographics Similar to Immigrants from China by Family Households
In terms of family households, the demographic groups most similar to Immigrants from China are Immigrants from Scotland (64.7%, a difference of 0.010%), Maltese (64.7%, a difference of 0.030%), Basque (64.7%, a difference of 0.030%), Immigrants from Jamaica (64.7%, a difference of 0.030%), and Immigrants from North Macedonia (64.7%, a difference of 0.040%).
| Demographics | Rating | Rank | Family Households |
| Immigrants | Ecuador | 91.4 /100 | #129 | Exceptional 64.8% |
| Immigrants | Italy | 90.2 /100 | #130 | Exceptional 64.8% |
| Immigrants | Nonimmigrants | 90.1 /100 | #131 | Exceptional 64.8% |
| Cajuns | 89.4 /100 | #132 | Excellent 64.8% |
| Belizeans | 89.3 /100 | #133 | Excellent 64.8% |
| Greeks | 88.1 /100 | #134 | Excellent 64.7% |
| Maltese | 87.4 /100 | #135 | Excellent 64.7% |
| Immigrants | China | 86.6 /100 | #136 | Excellent 64.7% |
| Immigrants | Scotland | 86.4 /100 | #137 | Excellent 64.7% |
| Basques | 85.5 /100 | #138 | Excellent 64.7% |
| Immigrants | Jamaica | 85.3 /100 | #139 | Excellent 64.7% |
| Immigrants | North Macedonia | 84.9 /100 | #140 | Excellent 64.7% |
| Immigrants | Cameroon | 84.8 /100 | #141 | Excellent 64.7% |
| Pakistanis | 84.0 /100 | #142 | Excellent 64.7% |
| Czechoslovakians | 82.1 /100 | #143 | Excellent 64.6% |
Demographics Similar to Germans by Family Households
In terms of family households, the demographic groups most similar to Germans are Canadian (64.4%, a difference of 0.010%), Lebanese (64.4%, a difference of 0.010%), Immigrants from Moldova (64.4%, a difference of 0.010%), Czech (64.5%, a difference of 0.020%), and Uruguayan (64.5%, a difference of 0.030%).
| Demographics | Rating | Rank | Family Households |
| Scottish | 70.9 /100 | #152 | Good 64.5% |
| Swedes | 69.8 /100 | #153 | Good 64.5% |
| Austrians | 68.5 /100 | #154 | Good 64.5% |
| Uruguayans | 67.7 /100 | #155 | Good 64.5% |
| Czechs | 67.0 /100 | #156 | Good 64.5% |
| Canadians | 66.6 /100 | #157 | Good 64.4% |
| Lebanese | 66.4 /100 | #158 | Good 64.4% |
| Germans | 65.8 /100 | #159 | Good 64.4% |
| Immigrants | Moldova | 65.2 /100 | #160 | Good 64.4% |
| Immigrants | England | 62.6 /100 | #161 | Good 64.4% |
| British | 61.6 /100 | #162 | Good 64.4% |
| Chickasaw | 61.5 /100 | #163 | Good 64.4% |
| Immigrants | Nigeria | 60.1 /100 | #164 | Good 64.4% |
| Immigrants | Southern Europe | 60.0 /100 | #165 | Good 64.4% |
| Scotch-Irish | 59.2 /100 | #166 | Average 64.4% |