Immigrants from Korea vs Romanian Currently Married
COMPARE
Immigrants from Korea
Romanian
Currently Married
Currently Married Comparison
Immigrants from Korea
Romanians
49.0%
CURRENTLY MARRIED
99.6/ 100
METRIC RATING
26th/ 347
METRIC RANK
48.4%
CURRENTLY MARRIED
98.5/ 100
METRIC RATING
61st/ 347
METRIC RANK
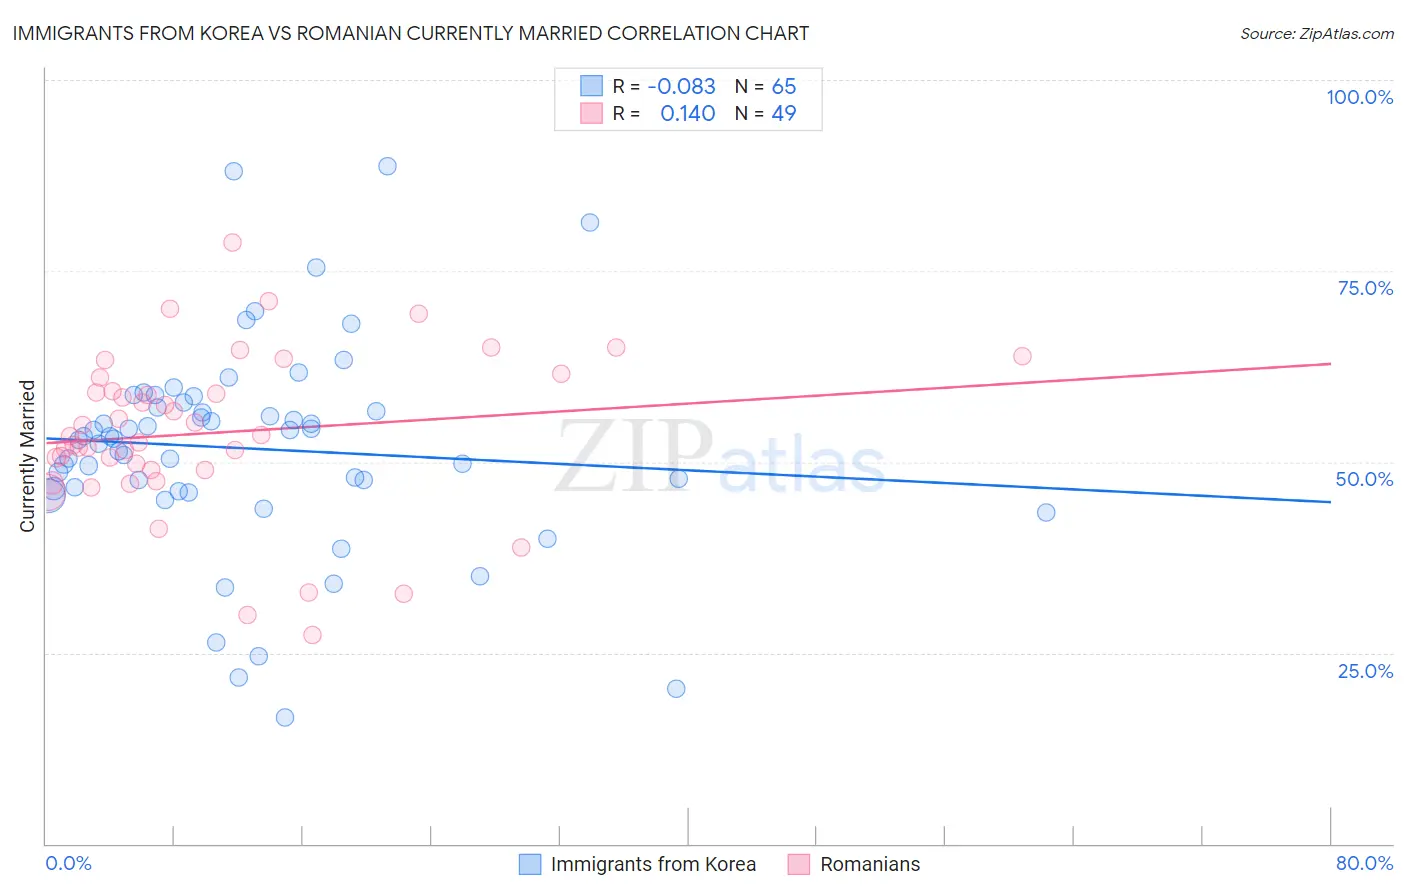
Immigrants from Korea vs Romanian Currently Married Correlation Chart
The statistical analysis conducted on geographies consisting of 416,263,579 people shows a slight negative correlation between the proportion of Immigrants from Korea and percentage of population currently married in the United States with a correlation coefficient (R) of -0.083 and weighted average of 49.0%. Similarly, the statistical analysis conducted on geographies consisting of 377,883,259 people shows a poor positive correlation between the proportion of Romanians and percentage of population currently married in the United States with a correlation coefficient (R) of 0.140 and weighted average of 48.4%, a difference of 1.2%.
Currently Married Correlation Summary
| Measurement | Immigrants from Korea | Romanian |
| Minimum | 16.6% | 27.3% |
| Maximum | 88.7% | 78.8% |
| Range | 72.1% | 51.5% |
| Mean | 51.8% | 53.8% |
| Median | 53.0% | 53.4% |
| Interquartile 25% (IQ1) | 46.4% | 48.9% |
| Interquartile 75% (IQ3) | 57.5% | 60.1% |
| Interquartile Range (IQR) | 11.1% | 11.2% |
| Standard Deviation (Sample) | 13.7% | 10.5% |
| Standard Deviation (Population) | 13.6% | 10.4% |
Similar Demographics by Currently Married
Demographics Similar to Immigrants from Korea by Currently Married
In terms of currently married, the demographic groups most similar to Immigrants from Korea are Maltese (49.0%, a difference of 0.050%), Lithuanian (49.0%, a difference of 0.060%), Burmese (48.9%, a difference of 0.070%), Welsh (48.9%, a difference of 0.11%), and Croatian (48.9%, a difference of 0.15%).
| Demographics | Rating | Rank | Currently Married |
| Europeans | 99.8 /100 | #19 | Exceptional 49.3% |
| Luxembourgers | 99.8 /100 | #20 | Exceptional 49.3% |
| Scottish | 99.8 /100 | #21 | Exceptional 49.2% |
| Bulgarians | 99.7 /100 | #22 | Exceptional 49.1% |
| Immigrants | Pakistan | 99.7 /100 | #23 | Exceptional 49.1% |
| Lithuanians | 99.6 /100 | #24 | Exceptional 49.0% |
| Maltese | 99.6 /100 | #25 | Exceptional 49.0% |
| Immigrants | Korea | 99.6 /100 | #26 | Exceptional 49.0% |
| Burmese | 99.6 /100 | #27 | Exceptional 48.9% |
| Welsh | 99.5 /100 | #28 | Exceptional 48.9% |
| Croatians | 99.5 /100 | #29 | Exceptional 48.9% |
| Eastern Europeans | 99.5 /100 | #30 | Exceptional 48.9% |
| Poles | 99.5 /100 | #31 | Exceptional 48.9% |
| Immigrants | Hong Kong | 99.5 /100 | #32 | Exceptional 48.9% |
| Irish | 99.5 /100 | #33 | Exceptional 48.9% |
Demographics Similar to Romanians by Currently Married
In terms of currently married, the demographic groups most similar to Romanians are Asian (48.4%, a difference of 0.0%), Immigrants from Romania (48.4%, a difference of 0.010%), Immigrants from Ireland (48.4%, a difference of 0.030%), French (48.4%, a difference of 0.050%), and Immigrants from Netherlands (48.5%, a difference of 0.10%).
| Demographics | Rating | Rank | Currently Married |
| Immigrants | Moldova | 98.7 /100 | #54 | Exceptional 48.5% |
| Immigrants | North Macedonia | 98.7 /100 | #55 | Exceptional 48.5% |
| Latvians | 98.7 /100 | #56 | Exceptional 48.5% |
| Immigrants | Netherlands | 98.6 /100 | #57 | Exceptional 48.5% |
| French | 98.6 /100 | #58 | Exceptional 48.4% |
| Immigrants | Ireland | 98.5 /100 | #59 | Exceptional 48.4% |
| Immigrants | Romania | 98.5 /100 | #60 | Exceptional 48.4% |
| Romanians | 98.5 /100 | #61 | Exceptional 48.4% |
| Asians | 98.5 /100 | #62 | Exceptional 48.4% |
| Slavs | 98.3 /100 | #63 | Exceptional 48.4% |
| Immigrants | Czechoslovakia | 98.3 /100 | #64 | Exceptional 48.4% |
| Ukrainians | 98.3 /100 | #65 | Exceptional 48.4% |
| Tongans | 98.2 /100 | #66 | Exceptional 48.3% |
| Slovaks | 98.2 /100 | #67 | Exceptional 48.3% |
| Immigrants | England | 98.2 /100 | #68 | Exceptional 48.3% |