Trinidadian and Tobagonian vs Romanian Currently Married
COMPARE
Trinidadian and Tobagonian
Romanian
Currently Married
Currently Married Comparison
Trinidadians and Tobagonians
Romanians
41.5%
CURRENTLY MARRIED
0.0/ 100
METRIC RATING
311th/ 347
METRIC RANK
48.4%
CURRENTLY MARRIED
98.5/ 100
METRIC RATING
61st/ 347
METRIC RANK
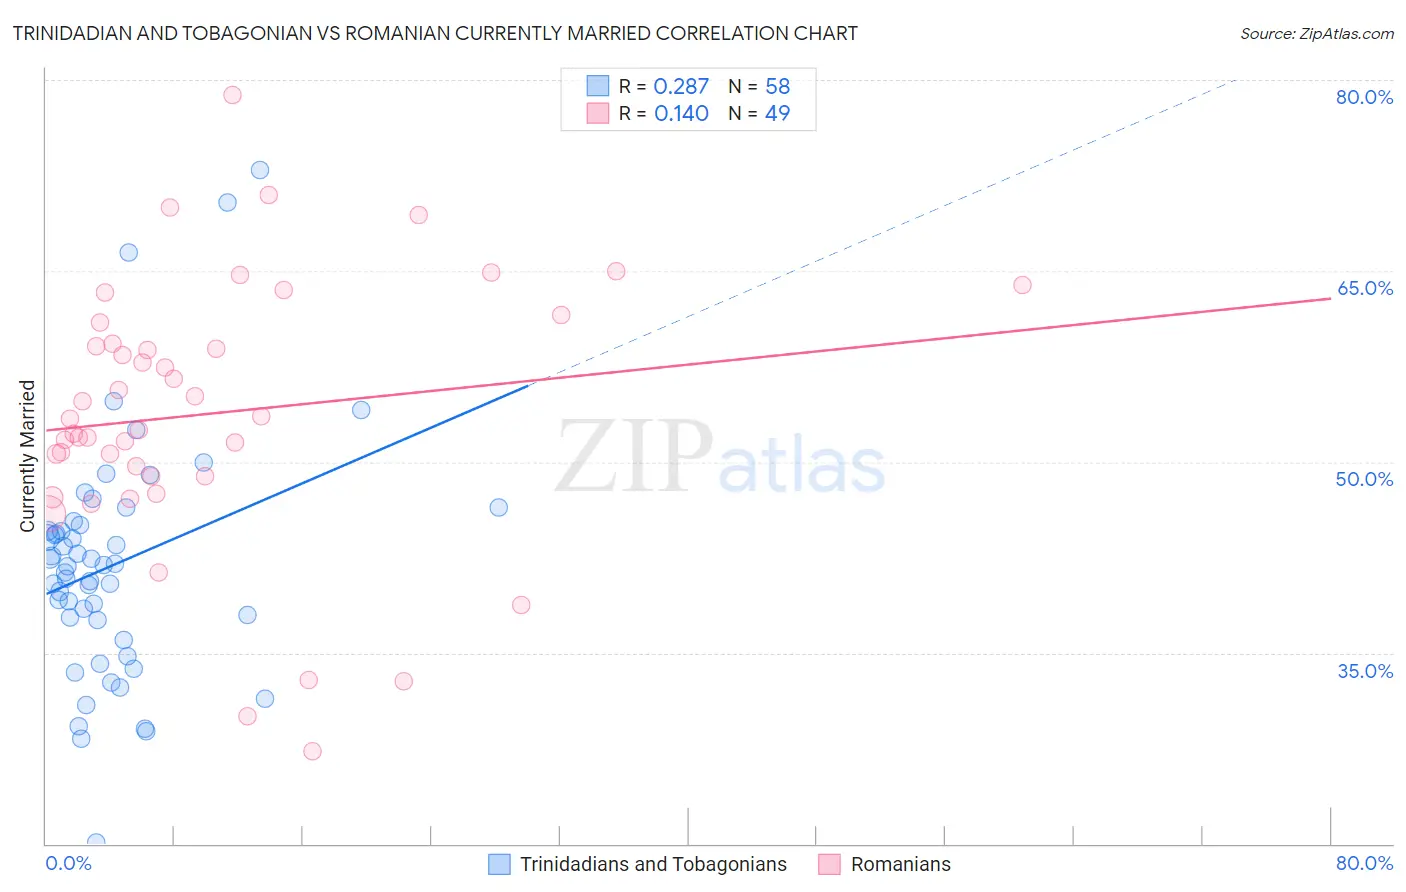
Trinidadian and Tobagonian vs Romanian Currently Married Correlation Chart
The statistical analysis conducted on geographies consisting of 219,846,005 people shows a weak positive correlation between the proportion of Trinidadians and Tobagonians and percentage of population currently married in the United States with a correlation coefficient (R) of 0.287 and weighted average of 41.5%. Similarly, the statistical analysis conducted on geographies consisting of 377,883,259 people shows a poor positive correlation between the proportion of Romanians and percentage of population currently married in the United States with a correlation coefficient (R) of 0.140 and weighted average of 48.4%, a difference of 16.5%.
Currently Married Correlation Summary
| Measurement | Trinidadian and Tobagonian | Romanian |
| Minimum | 20.1% | 27.3% |
| Maximum | 72.9% | 78.8% |
| Range | 52.8% | 51.5% |
| Mean | 41.9% | 53.8% |
| Median | 41.8% | 53.4% |
| Interquartile 25% (IQ1) | 37.6% | 48.9% |
| Interquartile 75% (IQ3) | 45.0% | 60.1% |
| Interquartile Range (IQR) | 7.5% | 11.2% |
| Standard Deviation (Sample) | 9.4% | 10.5% |
| Standard Deviation (Population) | 9.4% | 10.4% |
Similar Demographics by Currently Married
Demographics Similar to Trinidadians and Tobagonians by Currently Married
In terms of currently married, the demographic groups most similar to Trinidadians and Tobagonians are Guyanese (41.6%, a difference of 0.15%), Somali (41.5%, a difference of 0.18%), Jamaican (41.4%, a difference of 0.47%), Immigrants from Liberia (41.8%, a difference of 0.51%), and West Indian (41.3%, a difference of 0.55%).
| Demographics | Rating | Rank | Currently Married |
| Immigrants | Bahamas | 0.0 /100 | #304 | Tragic 41.9% |
| Immigrants | Trinidad and Tobago | 0.0 /100 | #305 | Tragic 41.9% |
| Immigrants | Guyana | 0.0 /100 | #306 | Tragic 41.9% |
| Africans | 0.0 /100 | #307 | Tragic 41.8% |
| Immigrants | Belize | 0.0 /100 | #308 | Tragic 41.8% |
| Immigrants | Liberia | 0.0 /100 | #309 | Tragic 41.8% |
| Guyanese | 0.0 /100 | #310 | Tragic 41.6% |
| Trinidadians and Tobagonians | 0.0 /100 | #311 | Tragic 41.5% |
| Somalis | 0.0 /100 | #312 | Tragic 41.5% |
| Jamaicans | 0.0 /100 | #313 | Tragic 41.4% |
| West Indians | 0.0 /100 | #314 | Tragic 41.3% |
| Inupiat | 0.0 /100 | #315 | Tragic 41.3% |
| Immigrants | Caribbean | 0.0 /100 | #316 | Tragic 41.3% |
| Haitians | 0.0 /100 | #317 | Tragic 41.3% |
| Bahamians | 0.0 /100 | #318 | Tragic 41.2% |
Demographics Similar to Romanians by Currently Married
In terms of currently married, the demographic groups most similar to Romanians are Asian (48.4%, a difference of 0.0%), Immigrants from Romania (48.4%, a difference of 0.010%), Immigrants from Ireland (48.4%, a difference of 0.030%), French (48.4%, a difference of 0.050%), and Immigrants from Netherlands (48.5%, a difference of 0.10%).
| Demographics | Rating | Rank | Currently Married |
| Immigrants | Moldova | 98.7 /100 | #54 | Exceptional 48.5% |
| Immigrants | North Macedonia | 98.7 /100 | #55 | Exceptional 48.5% |
| Latvians | 98.7 /100 | #56 | Exceptional 48.5% |
| Immigrants | Netherlands | 98.6 /100 | #57 | Exceptional 48.5% |
| French | 98.6 /100 | #58 | Exceptional 48.4% |
| Immigrants | Ireland | 98.5 /100 | #59 | Exceptional 48.4% |
| Immigrants | Romania | 98.5 /100 | #60 | Exceptional 48.4% |
| Romanians | 98.5 /100 | #61 | Exceptional 48.4% |
| Asians | 98.5 /100 | #62 | Exceptional 48.4% |
| Slavs | 98.3 /100 | #63 | Exceptional 48.4% |
| Immigrants | Czechoslovakia | 98.3 /100 | #64 | Exceptional 48.4% |
| Ukrainians | 98.3 /100 | #65 | Exceptional 48.4% |
| Tongans | 98.2 /100 | #66 | Exceptional 48.3% |
| Slovaks | 98.2 /100 | #67 | Exceptional 48.3% |
| Immigrants | England | 98.2 /100 | #68 | Exceptional 48.3% |