Immigrants from Armenia vs Immigrants from Korea Currently Married
COMPARE
Immigrants from Armenia
Immigrants from Korea
Currently Married
Currently Married Comparison
Immigrants from Armenia
Immigrants from Korea
44.3%
CURRENTLY MARRIED
0.4/ 100
METRIC RATING
245th/ 347
METRIC RANK
49.0%
CURRENTLY MARRIED
99.6/ 100
METRIC RATING
26th/ 347
METRIC RANK
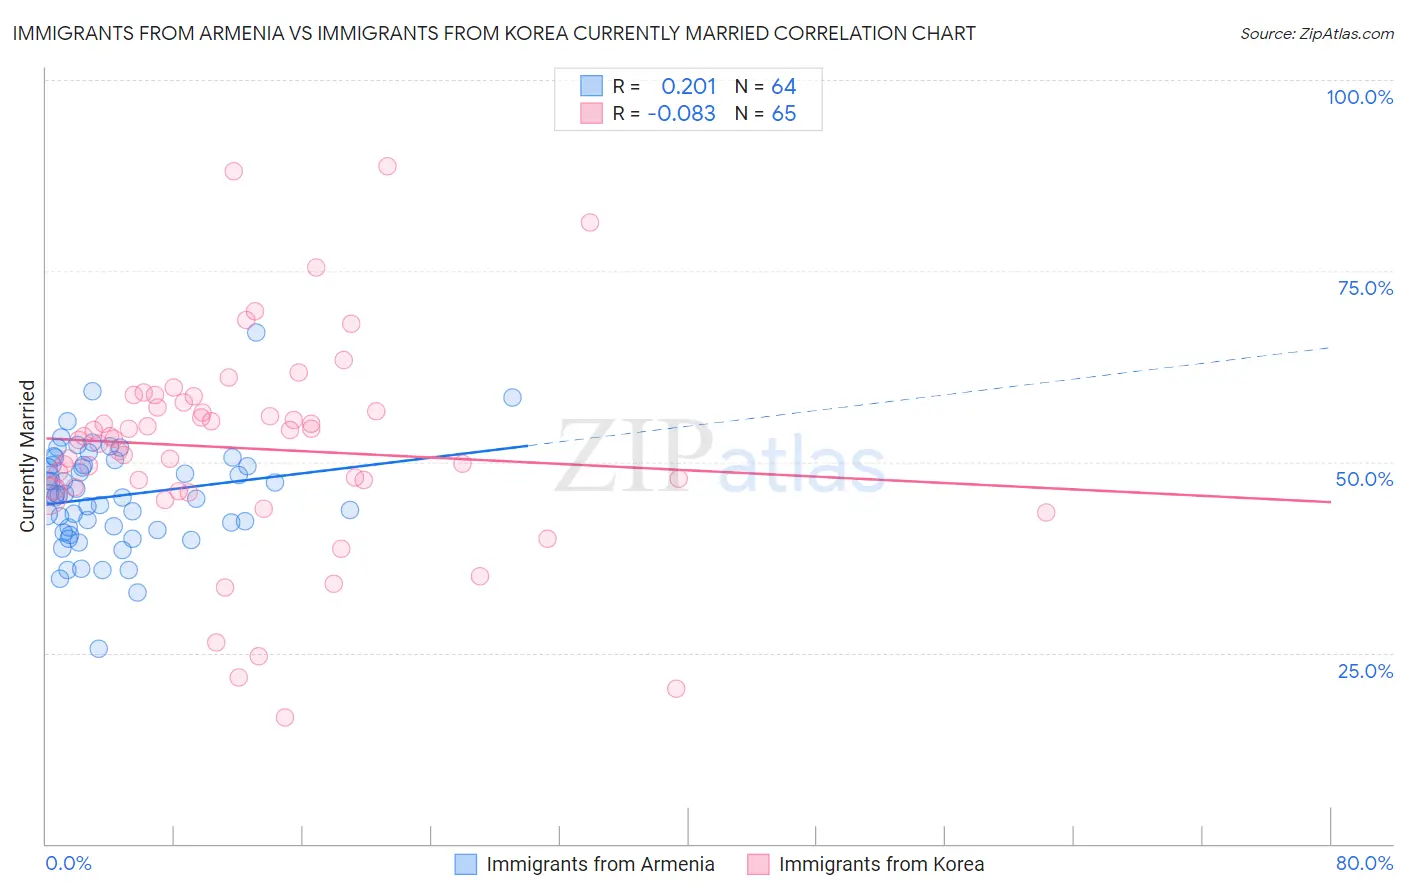
Immigrants from Armenia vs Immigrants from Korea Currently Married Correlation Chart
The statistical analysis conducted on geographies consisting of 97,725,276 people shows a weak positive correlation between the proportion of Immigrants from Armenia and percentage of population currently married in the United States with a correlation coefficient (R) of 0.201 and weighted average of 44.3%. Similarly, the statistical analysis conducted on geographies consisting of 416,263,579 people shows a slight negative correlation between the proportion of Immigrants from Korea and percentage of population currently married in the United States with a correlation coefficient (R) of -0.083 and weighted average of 49.0%, a difference of 10.5%.
Currently Married Correlation Summary
| Measurement | Immigrants from Armenia | Immigrants from Korea |
| Minimum | 25.6% | 16.6% |
| Maximum | 66.9% | 88.7% |
| Range | 41.3% | 72.1% |
| Mean | 45.5% | 51.8% |
| Median | 45.7% | 53.0% |
| Interquartile 25% (IQ1) | 41.2% | 46.4% |
| Interquartile 75% (IQ3) | 49.6% | 57.5% |
| Interquartile Range (IQR) | 8.3% | 11.1% |
| Standard Deviation (Sample) | 6.8% | 13.7% |
| Standard Deviation (Population) | 6.7% | 13.6% |
Similar Demographics by Currently Married
Demographics Similar to Immigrants from Armenia by Currently Married
In terms of currently married, the demographic groups most similar to Immigrants from Armenia are Immigrants from Burma/Myanmar (44.3%, a difference of 0.070%), Ugandan (44.2%, a difference of 0.20%), Nicaraguan (44.2%, a difference of 0.29%), Immigrants from Cameroon (44.2%, a difference of 0.30%), and Japanese (44.5%, a difference of 0.31%).
| Demographics | Rating | Rank | Currently Married |
| Moroccans | 0.9 /100 | #238 | Tragic 44.6% |
| Immigrants | Mexico | 0.7 /100 | #239 | Tragic 44.5% |
| Mexican American Indians | 0.7 /100 | #240 | Tragic 44.5% |
| Ethiopians | 0.7 /100 | #241 | Tragic 44.5% |
| Immigrants | Cambodia | 0.7 /100 | #242 | Tragic 44.5% |
| Immigrants | Ethiopia | 0.7 /100 | #243 | Tragic 44.5% |
| Japanese | 0.6 /100 | #244 | Tragic 44.5% |
| Immigrants | Armenia | 0.4 /100 | #245 | Tragic 44.3% |
| Immigrants | Burma/Myanmar | 0.4 /100 | #246 | Tragic 44.3% |
| Ugandans | 0.4 /100 | #247 | Tragic 44.2% |
| Nicaraguans | 0.3 /100 | #248 | Tragic 44.2% |
| Immigrants | Cameroon | 0.3 /100 | #249 | Tragic 44.2% |
| Immigrants | Eastern Africa | 0.3 /100 | #250 | Tragic 44.2% |
| Blackfeet | 0.3 /100 | #251 | Tragic 44.2% |
| Hispanics or Latinos | 0.3 /100 | #252 | Tragic 44.1% |
Demographics Similar to Immigrants from Korea by Currently Married
In terms of currently married, the demographic groups most similar to Immigrants from Korea are Maltese (49.0%, a difference of 0.050%), Lithuanian (49.0%, a difference of 0.060%), Burmese (48.9%, a difference of 0.070%), Welsh (48.9%, a difference of 0.11%), and Croatian (48.9%, a difference of 0.15%).
| Demographics | Rating | Rank | Currently Married |
| Europeans | 99.8 /100 | #19 | Exceptional 49.3% |
| Luxembourgers | 99.8 /100 | #20 | Exceptional 49.3% |
| Scottish | 99.8 /100 | #21 | Exceptional 49.2% |
| Bulgarians | 99.7 /100 | #22 | Exceptional 49.1% |
| Immigrants | Pakistan | 99.7 /100 | #23 | Exceptional 49.1% |
| Lithuanians | 99.6 /100 | #24 | Exceptional 49.0% |
| Maltese | 99.6 /100 | #25 | Exceptional 49.0% |
| Immigrants | Korea | 99.6 /100 | #26 | Exceptional 49.0% |
| Burmese | 99.6 /100 | #27 | Exceptional 48.9% |
| Welsh | 99.5 /100 | #28 | Exceptional 48.9% |
| Croatians | 99.5 /100 | #29 | Exceptional 48.9% |
| Eastern Europeans | 99.5 /100 | #30 | Exceptional 48.9% |
| Poles | 99.5 /100 | #31 | Exceptional 48.9% |
| Immigrants | Hong Kong | 99.5 /100 | #32 | Exceptional 48.9% |
| Irish | 99.5 /100 | #33 | Exceptional 48.9% |