Austrian vs Cuban Currently Married
COMPARE
Austrian
Cuban
Currently Married
Currently Married Comparison
Austrians
Cubans
48.7%
CURRENTLY MARRIED
99.2/ 100
METRIC RATING
48th/ 347
METRIC RANK
44.6%
CURRENTLY MARRIED
0.9/ 100
METRIC RATING
236th/ 347
METRIC RANK
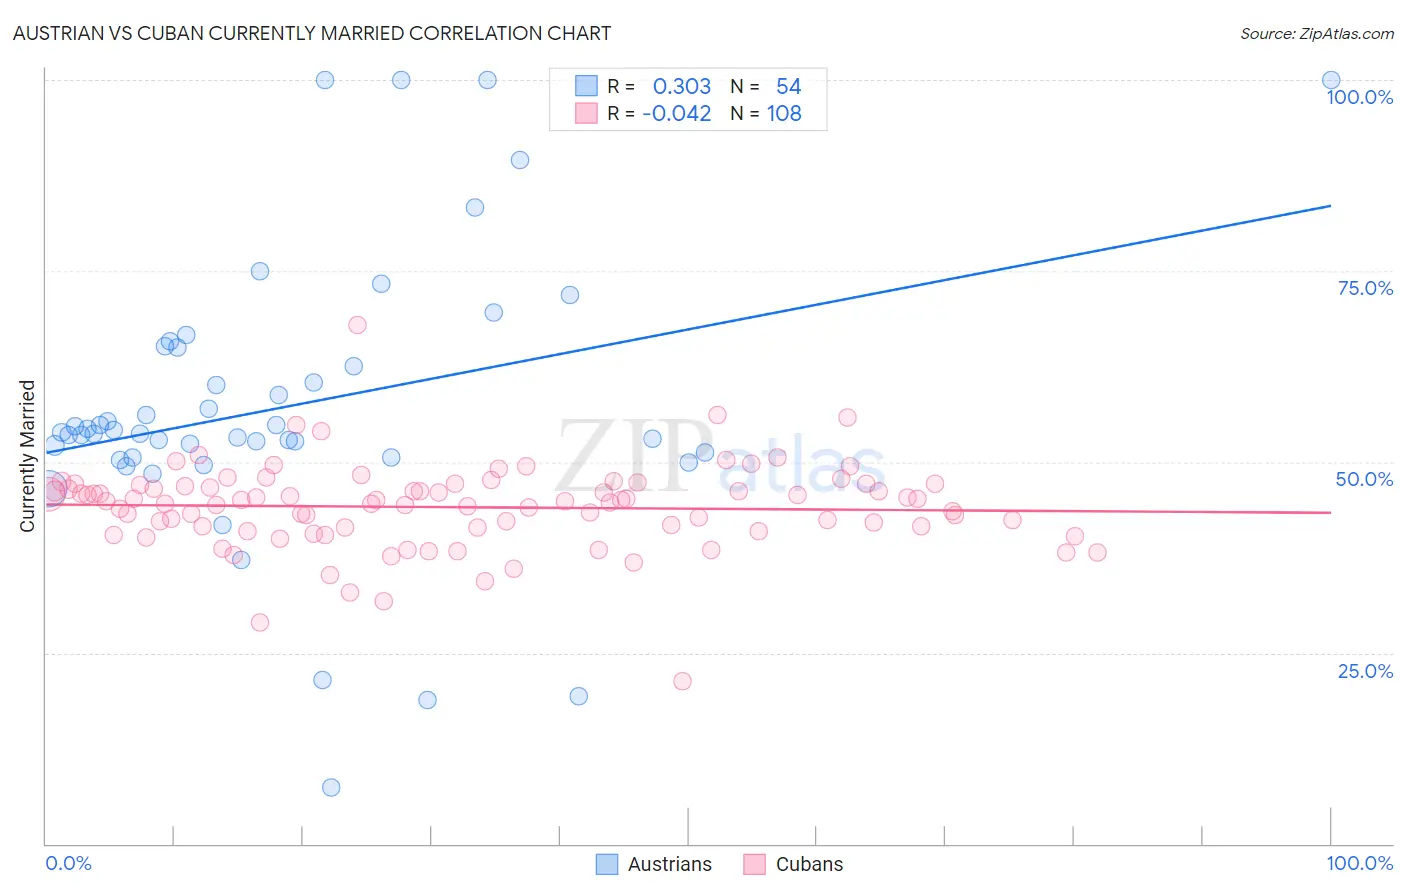
Austrian vs Cuban Currently Married Correlation Chart
The statistical analysis conducted on geographies consisting of 452,025,690 people shows a mild positive correlation between the proportion of Austrians and percentage of population currently married in the United States with a correlation coefficient (R) of 0.303 and weighted average of 48.7%. Similarly, the statistical analysis conducted on geographies consisting of 449,312,568 people shows no correlation between the proportion of Cubans and percentage of population currently married in the United States with a correlation coefficient (R) of -0.042 and weighted average of 44.6%, a difference of 9.1%.
Currently Married Correlation Summary
| Measurement | Austrian | Cuban |
| Minimum | 7.4% | 21.3% |
| Maximum | 100.0% | 67.9% |
| Range | 92.6% | 46.6% |
| Mean | 57.2% | 44.1% |
| Median | 53.8% | 44.8% |
| Interquartile 25% (IQ1) | 50.6% | 41.4% |
| Interquartile 75% (IQ3) | 64.9% | 46.9% |
| Interquartile Range (IQR) | 14.3% | 5.4% |
| Standard Deviation (Sample) | 18.6% | 5.7% |
| Standard Deviation (Population) | 18.5% | 5.6% |
Similar Demographics by Currently Married
Demographics Similar to Austrians by Currently Married
In terms of currently married, the demographic groups most similar to Austrians are Northern European (48.7%, a difference of 0.010%), Immigrants from Iran (48.7%, a difference of 0.020%), Belgian (48.7%, a difference of 0.050%), Immigrants from North America (48.7%, a difference of 0.080%), and Finnish (48.8%, a difference of 0.11%).
| Demographics | Rating | Rank | Currently Married |
| Greeks | 99.3 /100 | #41 | Exceptional 48.8% |
| Finns | 99.3 /100 | #42 | Exceptional 48.8% |
| Scotch-Irish | 99.3 /100 | #43 | Exceptional 48.7% |
| Immigrants | North America | 99.3 /100 | #44 | Exceptional 48.7% |
| Belgians | 99.3 /100 | #45 | Exceptional 48.7% |
| Immigrants | Iran | 99.2 /100 | #46 | Exceptional 48.7% |
| Northern Europeans | 99.2 /100 | #47 | Exceptional 48.7% |
| Austrians | 99.2 /100 | #48 | Exceptional 48.7% |
| Bhutanese | 99.1 /100 | #49 | Exceptional 48.6% |
| Iranians | 99.0 /100 | #50 | Exceptional 48.6% |
| Whites/Caucasians | 99.0 /100 | #51 | Exceptional 48.6% |
| Russians | 98.9 /100 | #52 | Exceptional 48.6% |
| Immigrants | Austria | 98.8 /100 | #53 | Exceptional 48.5% |
| Immigrants | Moldova | 98.7 /100 | #54 | Exceptional 48.5% |
| Immigrants | North Macedonia | 98.7 /100 | #55 | Exceptional 48.5% |
Demographics Similar to Cubans by Currently Married
In terms of currently married, the demographic groups most similar to Cubans are Seminole (44.6%, a difference of 0.0%), Alaskan Athabascan (44.6%, a difference of 0.010%), Moroccan (44.6%, a difference of 0.080%), Iroquois (44.7%, a difference of 0.16%), and Immigrants from Saudi Arabia (44.7%, a difference of 0.17%).
| Demographics | Rating | Rank | Currently Married |
| Cree | 1.7 /100 | #229 | Tragic 44.9% |
| Immigrants | Kenya | 1.6 /100 | #230 | Tragic 44.9% |
| Immigrants | Panama | 1.5 /100 | #231 | Tragic 44.9% |
| Nepalese | 1.2 /100 | #232 | Tragic 44.7% |
| Immigrants | Saudi Arabia | 1.1 /100 | #233 | Tragic 44.7% |
| Iroquois | 1.1 /100 | #234 | Tragic 44.7% |
| Alaskan Athabascans | 0.9 /100 | #235 | Tragic 44.6% |
| Cubans | 0.9 /100 | #236 | Tragic 44.6% |
| Seminole | 0.9 /100 | #237 | Tragic 44.6% |
| Moroccans | 0.9 /100 | #238 | Tragic 44.6% |
| Immigrants | Mexico | 0.7 /100 | #239 | Tragic 44.5% |
| Mexican American Indians | 0.7 /100 | #240 | Tragic 44.5% |
| Ethiopians | 0.7 /100 | #241 | Tragic 44.5% |
| Immigrants | Cambodia | 0.7 /100 | #242 | Tragic 44.5% |
| Immigrants | Ethiopia | 0.7 /100 | #243 | Tragic 44.5% |