Austrian vs Immigrants from Zimbabwe Disability Age 65 to 74
COMPARE
Austrian
Immigrants from Zimbabwe
Disability Age 65 to 74
Disability Age 65 to 74 Comparison
Austrians
Immigrants from Zimbabwe
22.4%
DISABILITY AGE 65 TO 74
94.7/ 100
METRIC RATING
118th/ 347
METRIC RANK
22.3%
DISABILITY AGE 65 TO 74
96.1/ 100
METRIC RATING
108th/ 347
METRIC RANK
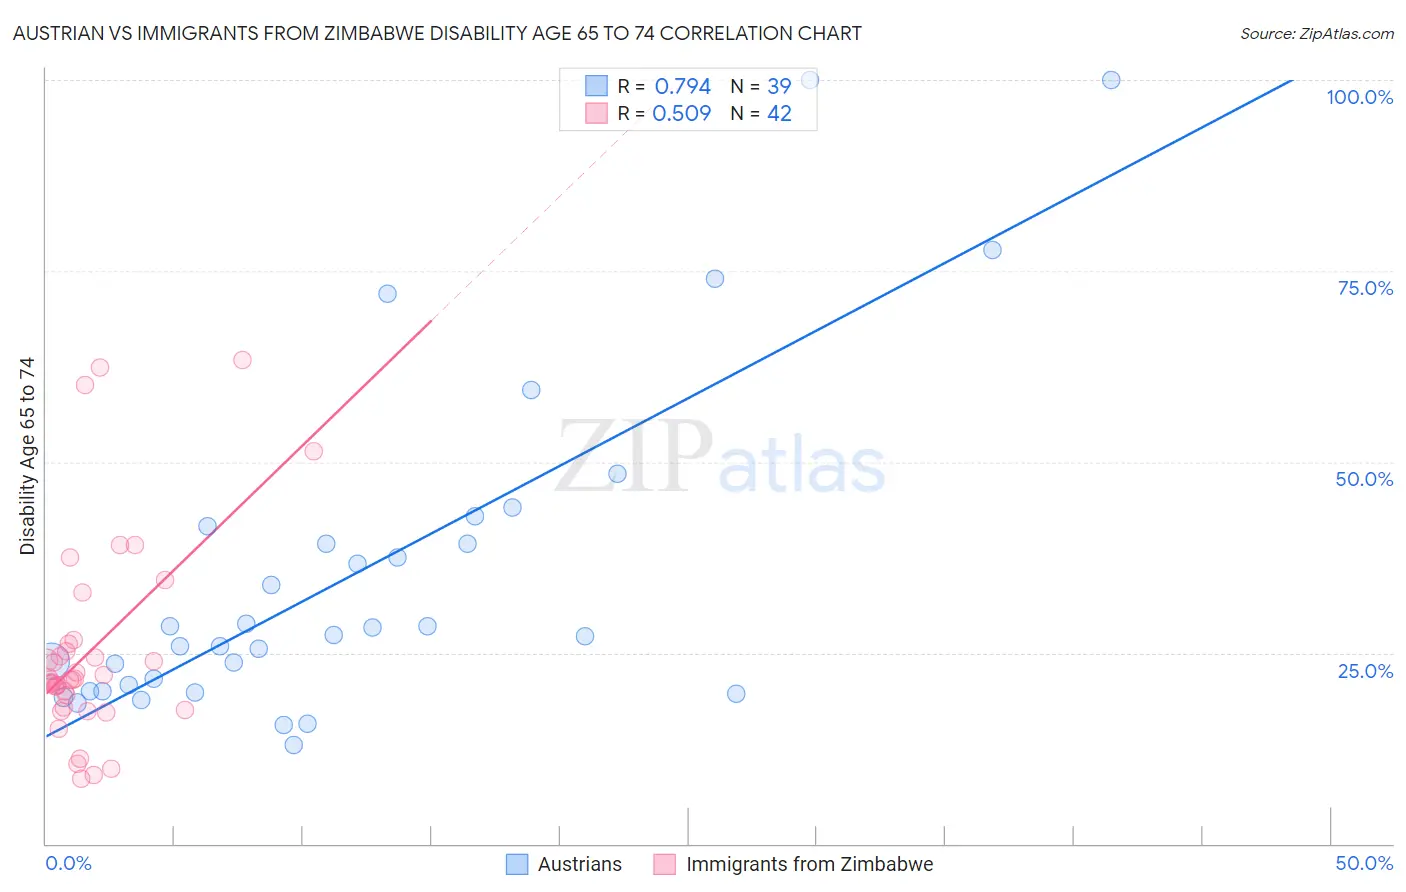
Austrian vs Immigrants from Zimbabwe Disability Age 65 to 74 Correlation Chart
The statistical analysis conducted on geographies consisting of 451,186,981 people shows a strong positive correlation between the proportion of Austrians and percentage of population with a disability between the ages 65 and 75 in the United States with a correlation coefficient (R) of 0.794 and weighted average of 22.4%. Similarly, the statistical analysis conducted on geographies consisting of 117,717,454 people shows a substantial positive correlation between the proportion of Immigrants from Zimbabwe and percentage of population with a disability between the ages 65 and 75 in the United States with a correlation coefficient (R) of 0.509 and weighted average of 22.3%, a difference of 0.47%.
Disability Age 65 to 74 Correlation Summary
| Measurement | Austrian | Immigrants from Zimbabwe |
| Minimum | 13.0% | 8.6% |
| Maximum | 100.0% | 63.3% |
| Range | 87.0% | 54.7% |
| Mean | 35.5% | 25.4% |
| Median | 27.3% | 21.6% |
| Interquartile 25% (IQ1) | 19.9% | 17.8% |
| Interquartile 75% (IQ3) | 41.5% | 26.2% |
| Interquartile Range (IQR) | 21.6% | 8.4% |
| Standard Deviation (Sample) | 22.0% | 13.3% |
| Standard Deviation (Population) | 21.7% | 13.2% |
Demographics Similar to Austrians and Immigrants from Zimbabwe by Disability Age 65 to 74
In terms of disability age 65 to 74, the demographic groups most similar to Austrians are Swedish (22.4%, a difference of 0.0%), Immigrants from Northern Africa (22.4%, a difference of 0.010%), Brazilian (22.4%, a difference of 0.020%), Laotian (22.3%, a difference of 0.060%), and Ukrainian (22.3%, a difference of 0.12%). Similarly, the demographic groups most similar to Immigrants from Zimbabwe are Slovene (22.2%, a difference of 0.010%), Peruvian (22.2%, a difference of 0.020%), Palestinian (22.2%, a difference of 0.080%), Albanian (22.3%, a difference of 0.090%), and Colombian (22.2%, a difference of 0.12%).
| Demographics | Rating | Rank | Disability Age 65 to 74 |
| South Americans | 96.4 /100 | #103 | Exceptional 22.2% |
| Colombians | 96.4 /100 | #104 | Exceptional 22.2% |
| Palestinians | 96.3 /100 | #105 | Exceptional 22.2% |
| Peruvians | 96.1 /100 | #106 | Exceptional 22.2% |
| Slovenes | 96.1 /100 | #107 | Exceptional 22.2% |
| Immigrants | Zimbabwe | 96.1 /100 | #108 | Exceptional 22.3% |
| Albanians | 95.8 /100 | #109 | Exceptional 22.3% |
| Immigrants | Peru | 95.7 /100 | #110 | Exceptional 22.3% |
| Serbians | 95.7 /100 | #111 | Exceptional 22.3% |
| Immigrants | South America | 95.5 /100 | #112 | Exceptional 22.3% |
| Syrians | 95.3 /100 | #113 | Exceptional 22.3% |
| Ukrainians | 95.1 /100 | #114 | Exceptional 22.3% |
| Laotians | 94.9 /100 | #115 | Exceptional 22.3% |
| Brazilians | 94.8 /100 | #116 | Exceptional 22.4% |
| Swedes | 94.7 /100 | #117 | Exceptional 22.4% |
| Austrians | 94.7 /100 | #118 | Exceptional 22.4% |
| Immigrants | Northern Africa | 94.7 /100 | #119 | Exceptional 22.4% |
| Immigrants | Kazakhstan | 93.9 /100 | #120 | Exceptional 22.4% |
| Czechs | 93.5 /100 | #121 | Exceptional 22.4% |
| Immigrants | Jordan | 93.5 /100 | #122 | Exceptional 22.4% |
| Hungarians | 93.3 /100 | #123 | Exceptional 22.4% |