Austrian vs Immigrants from Grenada Single Mother Households
COMPARE
Austrian
Immigrants from Grenada
Single Mother Households
Single Mother Households Comparison
Austrians
Immigrants from Grenada
5.7%
SINGLE MOTHER HOUSEHOLDS
96.4/ 100
METRIC RATING
96th/ 347
METRIC RANK
8.2%
SINGLE MOTHER HOUSEHOLDS
0.0/ 100
METRIC RATING
313th/ 347
METRIC RANK
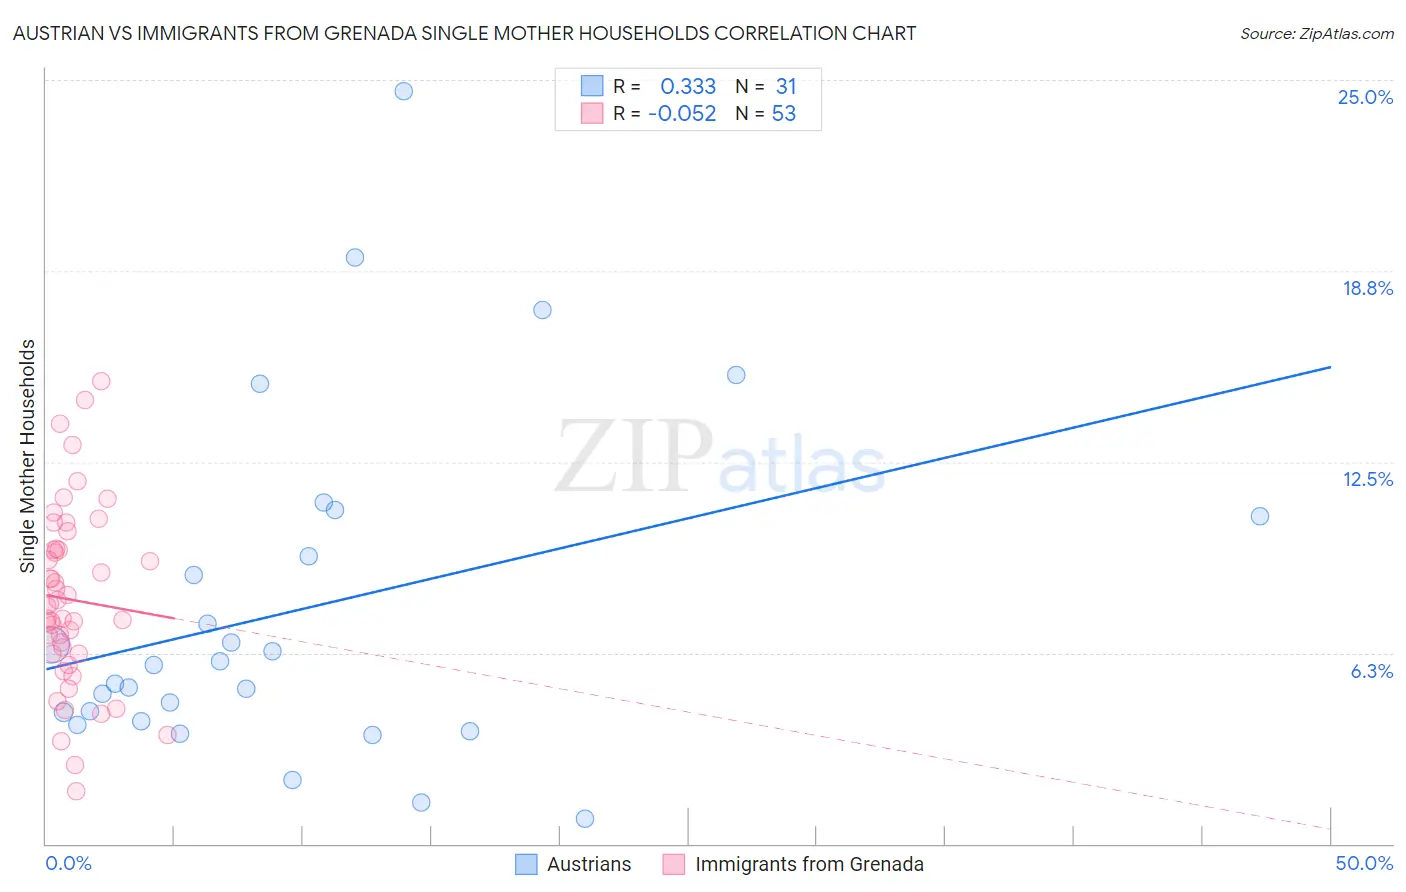
Austrian vs Immigrants from Grenada Single Mother Households Correlation Chart
The statistical analysis conducted on geographies consisting of 449,998,235 people shows a mild positive correlation between the proportion of Austrians and percentage of single mother households in the United States with a correlation coefficient (R) of 0.333 and weighted average of 5.7%. Similarly, the statistical analysis conducted on geographies consisting of 67,162,993 people shows a slight negative correlation between the proportion of Immigrants from Grenada and percentage of single mother households in the United States with a correlation coefficient (R) of -0.052 and weighted average of 8.2%, a difference of 42.0%.
Single Mother Households Correlation Summary
| Measurement | Austrian | Immigrants from Grenada |
| Minimum | 0.83% | 1.7% |
| Maximum | 24.6% | 15.1% |
| Range | 23.8% | 13.4% |
| Mean | 7.7% | 8.0% |
| Median | 5.8% | 7.8% |
| Interquartile 25% (IQ1) | 4.0% | 6.2% |
| Interquartile 75% (IQ3) | 10.7% | 9.6% |
| Interquartile Range (IQR) | 6.7% | 3.4% |
| Standard Deviation (Sample) | 5.6% | 2.9% |
| Standard Deviation (Population) | 5.5% | 2.9% |
Similar Demographics by Single Mother Households
Demographics Similar to Austrians by Single Mother Households
In terms of single mother households, the demographic groups most similar to Austrians are Tlingit-Haida (5.7%, a difference of 0.050%), Immigrants from South Africa (5.7%, a difference of 0.090%), Slovak (5.7%, a difference of 0.15%), Immigrants from Poland (5.8%, a difference of 0.15%), and Scandinavian (5.8%, a difference of 0.16%).
| Demographics | Rating | Rank | Single Mother Households |
| Ukrainians | 97.2 /100 | #89 | Exceptional 5.7% |
| Immigrants | Indonesia | 97.2 /100 | #90 | Exceptional 5.7% |
| Europeans | 97.0 /100 | #91 | Exceptional 5.7% |
| Immigrants | Western Asia | 96.7 /100 | #92 | Exceptional 5.7% |
| Serbians | 96.7 /100 | #93 | Exceptional 5.7% |
| Basques | 96.7 /100 | #94 | Exceptional 5.7% |
| Slovaks | 96.6 /100 | #95 | Exceptional 5.7% |
| Austrians | 96.4 /100 | #96 | Exceptional 5.7% |
| Tlingit-Haida | 96.4 /100 | #97 | Exceptional 5.7% |
| Immigrants | South Africa | 96.3 /100 | #98 | Exceptional 5.7% |
| Immigrants | Poland | 96.3 /100 | #99 | Exceptional 5.8% |
| Scandinavians | 96.2 /100 | #100 | Exceptional 5.8% |
| Germans | 96.2 /100 | #101 | Exceptional 5.8% |
| English | 96.2 /100 | #102 | Exceptional 5.8% |
| Scottish | 96.2 /100 | #103 | Exceptional 5.8% |
Demographics Similar to Immigrants from Grenada by Single Mother Households
In terms of single mother households, the demographic groups most similar to Immigrants from Grenada are Immigrants from Mexico (8.2%, a difference of 0.12%), Immigrants from Western Africa (8.2%, a difference of 0.15%), Bangladeshi (8.1%, a difference of 0.16%), African (8.2%, a difference of 0.29%), and Immigrants from Honduras (8.2%, a difference of 0.43%).
| Demographics | Rating | Rank | Single Mother Households |
| Immigrants | Barbados | 0.0 /100 | #306 | Tragic 8.0% |
| Immigrants | St. Vincent and the Grenadines | 0.0 /100 | #307 | Tragic 8.0% |
| Immigrants | Central America | 0.0 /100 | #308 | Tragic 8.1% |
| Cheyenne | 0.0 /100 | #309 | Tragic 8.1% |
| Hondurans | 0.0 /100 | #310 | Tragic 8.1% |
| Immigrants | Congo | 0.0 /100 | #311 | Tragic 8.1% |
| Bangladeshis | 0.0 /100 | #312 | Tragic 8.1% |
| Immigrants | Grenada | 0.0 /100 | #313 | Tragic 8.2% |
| Immigrants | Mexico | 0.0 /100 | #314 | Tragic 8.2% |
| Immigrants | Western Africa | 0.0 /100 | #315 | Tragic 8.2% |
| Africans | 0.0 /100 | #316 | Tragic 8.2% |
| Immigrants | Honduras | 0.0 /100 | #317 | Tragic 8.2% |
| Senegalese | 0.0 /100 | #318 | Tragic 8.2% |
| Jamaicans | 0.0 /100 | #319 | Tragic 8.2% |
| Bahamians | 0.0 /100 | #320 | Tragic 8.3% |