Austrian vs Immigrants from Liberia Single Mother Households
COMPARE
Austrian
Immigrants from Liberia
Single Mother Households
Single Mother Households Comparison
Austrians
Immigrants from Liberia
5.7%
SINGLE MOTHER HOUSEHOLDS
96.4/ 100
METRIC RATING
96th/ 347
METRIC RANK
8.7%
SINGLE MOTHER HOUSEHOLDS
0.0/ 100
METRIC RATING
334th/ 347
METRIC RANK
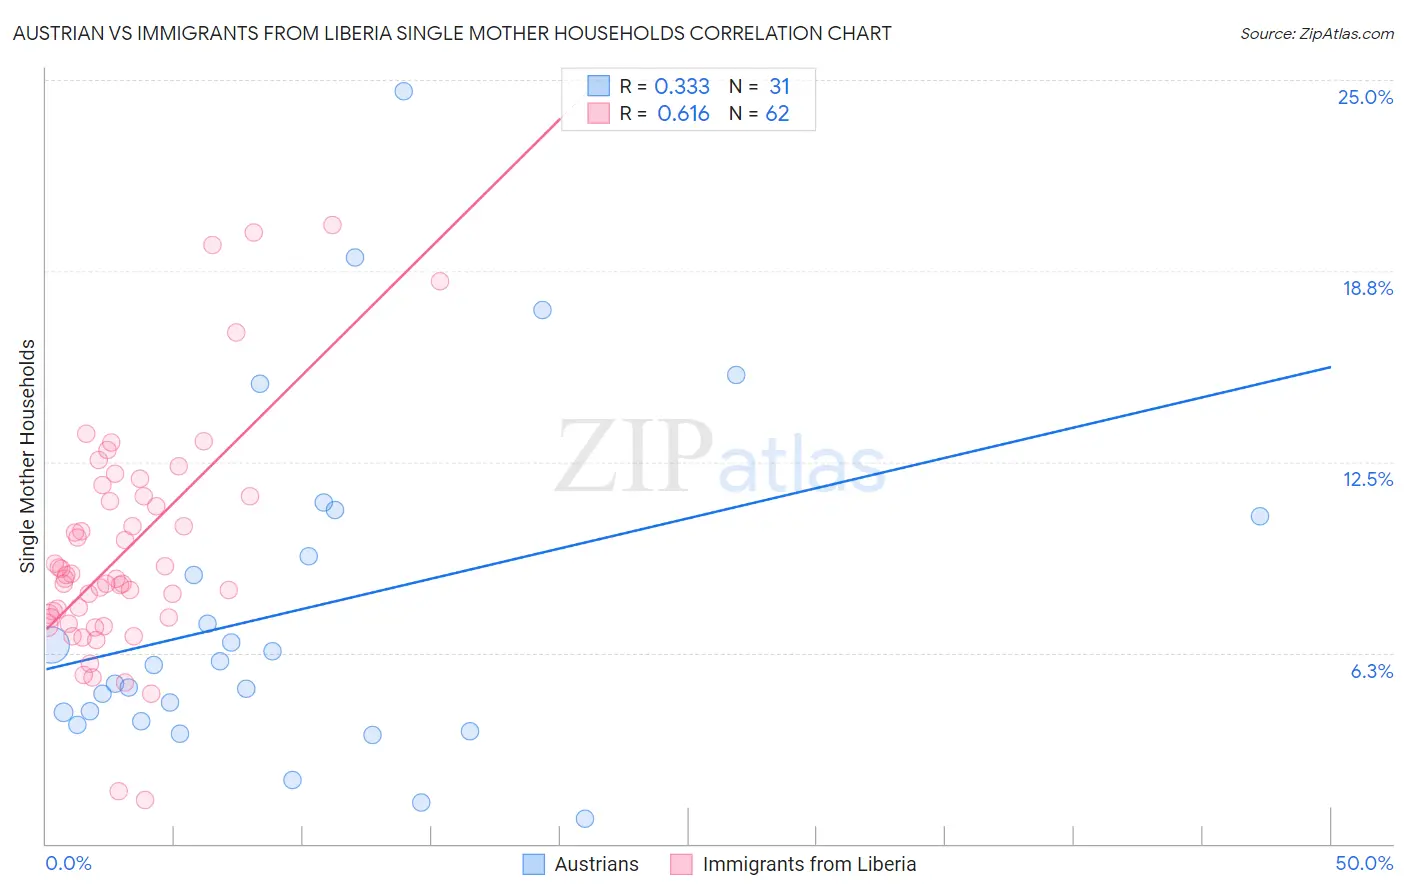
Austrian vs Immigrants from Liberia Single Mother Households Correlation Chart
The statistical analysis conducted on geographies consisting of 449,998,235 people shows a mild positive correlation between the proportion of Austrians and percentage of single mother households in the United States with a correlation coefficient (R) of 0.333 and weighted average of 5.7%. Similarly, the statistical analysis conducted on geographies consisting of 135,205,486 people shows a significant positive correlation between the proportion of Immigrants from Liberia and percentage of single mother households in the United States with a correlation coefficient (R) of 0.616 and weighted average of 8.7%, a difference of 51.7%.
Single Mother Households Correlation Summary
| Measurement | Austrian | Immigrants from Liberia |
| Minimum | 0.83% | 1.4% |
| Maximum | 24.6% | 20.2% |
| Range | 23.8% | 18.8% |
| Mean | 7.7% | 9.6% |
| Median | 5.8% | 8.7% |
| Interquartile 25% (IQ1) | 4.0% | 7.4% |
| Interquartile 75% (IQ3) | 10.7% | 11.4% |
| Interquartile Range (IQR) | 6.7% | 4.0% |
| Standard Deviation (Sample) | 5.6% | 3.8% |
| Standard Deviation (Population) | 5.5% | 3.7% |
Similar Demographics by Single Mother Households
Demographics Similar to Austrians by Single Mother Households
In terms of single mother households, the demographic groups most similar to Austrians are Tlingit-Haida (5.7%, a difference of 0.050%), Immigrants from South Africa (5.7%, a difference of 0.090%), Slovak (5.7%, a difference of 0.15%), Immigrants from Poland (5.8%, a difference of 0.15%), and Scandinavian (5.8%, a difference of 0.16%).
| Demographics | Rating | Rank | Single Mother Households |
| Ukrainians | 97.2 /100 | #89 | Exceptional 5.7% |
| Immigrants | Indonesia | 97.2 /100 | #90 | Exceptional 5.7% |
| Europeans | 97.0 /100 | #91 | Exceptional 5.7% |
| Immigrants | Western Asia | 96.7 /100 | #92 | Exceptional 5.7% |
| Serbians | 96.7 /100 | #93 | Exceptional 5.7% |
| Basques | 96.7 /100 | #94 | Exceptional 5.7% |
| Slovaks | 96.6 /100 | #95 | Exceptional 5.7% |
| Austrians | 96.4 /100 | #96 | Exceptional 5.7% |
| Tlingit-Haida | 96.4 /100 | #97 | Exceptional 5.7% |
| Immigrants | South Africa | 96.3 /100 | #98 | Exceptional 5.7% |
| Immigrants | Poland | 96.3 /100 | #99 | Exceptional 5.8% |
| Scandinavians | 96.2 /100 | #100 | Exceptional 5.8% |
| Germans | 96.2 /100 | #101 | Exceptional 5.8% |
| English | 96.2 /100 | #102 | Exceptional 5.8% |
| Scottish | 96.2 /100 | #103 | Exceptional 5.8% |
Demographics Similar to Immigrants from Liberia by Single Mother Households
In terms of single mother households, the demographic groups most similar to Immigrants from Liberia are Immigrants from Dominica (8.7%, a difference of 0.29%), Puerto Rican (8.7%, a difference of 0.33%), Liberian (8.6%, a difference of 0.80%), U.S. Virgin Islander (8.6%, a difference of 1.1%), and Navajo (8.8%, a difference of 1.5%).
| Demographics | Rating | Rank | Single Mother Households |
| Immigrants | Haiti | 0.0 /100 | #327 | Tragic 8.4% |
| Yakama | 0.0 /100 | #328 | Tragic 8.4% |
| Hopi | 0.0 /100 | #329 | Tragic 8.5% |
| Inupiat | 0.0 /100 | #330 | Tragic 8.5% |
| Sioux | 0.0 /100 | #331 | Tragic 8.5% |
| U.S. Virgin Islanders | 0.0 /100 | #332 | Tragic 8.6% |
| Liberians | 0.0 /100 | #333 | Tragic 8.6% |
| Immigrants | Liberia | 0.0 /100 | #334 | Tragic 8.7% |
| Immigrants | Dominica | 0.0 /100 | #335 | Tragic 8.7% |
| Puerto Ricans | 0.0 /100 | #336 | Tragic 8.7% |
| Navajo | 0.0 /100 | #337 | Tragic 8.8% |
| Cape Verdeans | 0.0 /100 | #338 | Tragic 8.9% |
| Blacks/African Americans | 0.0 /100 | #339 | Tragic 9.0% |
| Lumbee | 0.0 /100 | #340 | Tragic 9.1% |
| Tohono O'odham | 0.0 /100 | #341 | Tragic 9.1% |