Austrian vs Somali Single Mother Households

COMPARE

Austrian
Race
Ancestry
AfghanAfricanAlaska NativeAlaskan AthabascanAlbanianAleutAlsatianAmericanApacheArabArapahoArgentineanArmenianAssyrian/Chaldean/SyriacAustralianAustrianBahamianBangladeshiBarbadianBasqueBelgianBelizeanBermudanBhutaneseBlackfeetBolivianBrazilianBritishBritish West IndianBulgarianBurmeseCajunCambodianCanadianCape VerdeanCarpatho RusynCelticCentral AmericanCentral American IndianCherokeeCheyenneChickasawChileanChineseChippewaChoctawColombianColvilleComancheCosta RicanCreeCreekCroatianCrowCubanCypriotCzechCzechoslovakianDanishDelawareDominicanDutchDutch West IndianEastern EuropeanEcuadorianEgyptianEnglishEstonianEthiopianEuropeanFijianFilipinoFinnishFrenchFrench American IndianFrench CanadianGermanGerman RussianGhanaianGreekGuamanian/ChamorroGuatemalanGuyaneseHaitianHmongHonduranHopiHoumaHungarianIcelanderIndian (Asian)IndonesianInupiatIranianIraqiIrishIroquoisIsraeliItalianJamaicanJapaneseJordanianKenyanKiowaKoreanLaotianLatvianLebaneseLiberianLithuanianLumbeeLuxembourgerMacedonianMalaysianMalteseMarshalleseMenomineeMexicanMexican American IndianMongolianMoroccanNative HawaiianNavajoNepaleseNew ZealanderNicaraguanNigerianNorthern EuropeanNorwegianOkinawanOsageOttawaPaiutePakistaniPalestinianPanamanianParaguayanPennsylvania GermanPeruvianPimaPolishPortuguesePotawatomiPuebloPuerto RicanPuget Sound SalishRomanianRussianSalvadoranSamoanScandinavianScotch-IrishScottishSeminoleSenegaleseSerbianShoshoneSierra LeoneanSiouxSlavicSlovakSloveneSouth AfricanSouth AmericanSouth American IndianSoviet UnionSpaniardSpanishSpanish AmericanSpanish American IndianSri LankanSubsaharan AfricanSudaneseSwedishSwissSyrianTaiwaneseThaiTlingit-HaidaTohono O'OdhamTonganTrinidadian and TobagonianTsimshianTurkishU.S. Virgin IslanderUgandanUkrainianUruguayanUteVenezuelanVietnameseWelshWest IndianYakamaYaquiYugoslavianYumanYup'ikZimbabwean
Immigration
NonimmigrantsImmigrantsAfghanistanAfricaAlbaniaArgentinaArmeniaAsiaAustraliaAustriaBahamasBangladeshBarbadosBelarusBelgiumBelizeBoliviaBosnia and HerzegovinaBrazilBulgariaBurma/MyanmarCabo VerdeCambodiaCameroonCanadaCaribbeanCentral AmericaChileChinaColombiaCongoCosta RicaCroatiaCubaCzechoslovakiaDenmarkDominicaDominican RepublicEastern AfricaEastern AsiaEastern EuropeEcuadorEgyptEl SalvadorEnglandEritreaEthiopiaEuropeFijiFranceGermanyGhanaGreeceGrenadaGuatemalaGuyanaHaitiHondurasHong KongHungaryIndiaIndonesiaIranIraqIrelandIsraelItalyJamaicaJapanJordanKazakhstanKenyaKoreaKuwaitLaosLatin AmericaLatviaLebanonLiberiaLithuaniaMalaysiaMexicoMicronesiaMiddle AfricaMoldovaMoroccoNepalNetherlandsNicaraguaNigeriaNorth AmericaNorth MacedoniaNorthern AfricaNorthern EuropeNorwayOceaniaPakistanPanamaPeruPhilippinesPolandPortugalRomaniaRussiaSaudi ArabiaScotlandSenegalSerbiaSierra LeoneSingaporeSomaliaSouth AfricaSouth AmericaSouth Central AsiaSouth Eastern AsiaSouthern EuropeSpainSri LankaSt. Vincent and the GrenadinesSudanSwedenSwitzerlandSyriaTaiwanThailandTrinidad and TobagoTurkeyUgandaUkraineUruguayUzbekistanVenezuelaVietnamWest IndiesWestern AfricaWestern AsiaWestern EuropeYemenZaireZimbabweAzores
Somali
Race
Ancestry
AfghanAfricanAlaska NativeAlaskan AthabascanAlbanianAleutAlsatianAmericanApacheArabArapahoArgentineanArmenianAssyrian/Chaldean/SyriacAustralianBahamianBangladeshiBarbadianBasqueBelgianBelizeanBermudanBhutaneseBlackfeetBolivianBrazilianBritishBritish West IndianBulgarianBurmeseCajunCambodianCanadianCape VerdeanCarpatho RusynCelticCentral AmericanCentral American IndianCherokeeCheyenneChickasawChileanChineseChippewaChoctawColombianColvilleComancheCosta RicanCreeCreekCroatianCrowCubanCypriotCzechCzechoslovakianDanishDelawareDominicanDutchDutch West IndianEastern EuropeanEcuadorianEgyptianEnglishEstonianEthiopianEuropeanFijianFilipinoFinnishFrenchFrench American IndianFrench CanadianGermanGerman RussianGhanaianGreekGuamanian/ChamorroGuatemalanGuyaneseHaitianHmongHonduranHopiHoumaHungarianIcelanderIndian (Asian)IndonesianInupiatIranianIraqiIrishIroquoisIsraeliItalianJamaicanJapaneseJordanianKenyanKiowaKoreanLaotianLatvianLebaneseLiberianLithuanianLumbeeLuxembourgerMacedonianMalaysianMalteseMarshalleseMenomineeMexicanMexican American IndianMongolianMoroccanNative HawaiianNavajoNepaleseNew ZealanderNicaraguanNigerianNorthern EuropeanNorwegianOkinawanOsageOttawaPaiutePakistaniPalestinianPanamanianParaguayanPennsylvania GermanPeruvianPimaPolishPortuguesePotawatomiPuebloPuerto RicanPuget Sound SalishRomanianRussianSalvadoranSamoanScandinavianScotch-IrishScottishSeminoleSenegaleseSerbianShoshoneSierra LeoneanSiouxSlavicSlovakSloveneSomaliSouth AfricanSouth AmericanSouth American IndianSoviet UnionSpaniardSpanishSpanish AmericanSpanish American IndianSri LankanSubsaharan AfricanSudaneseSwedishSwissSyrianTaiwaneseThaiTlingit-HaidaTohono O'OdhamTonganTrinidadian and TobagonianTsimshianTurkishU.S. Virgin IslanderUgandanUkrainianUruguayanUteVenezuelanVietnameseWelshWest IndianYakamaYaquiYugoslavianYumanYup'ikZimbabwean
Immigration
NonimmigrantsImmigrantsAfghanistanAfricaAlbaniaArgentinaArmeniaAsiaAustraliaAustriaBahamasBangladeshBarbadosBelarusBelgiumBelizeBoliviaBosnia and HerzegovinaBrazilBulgariaBurma/MyanmarCabo VerdeCambodiaCameroonCanadaCaribbeanCentral AmericaChileChinaColombiaCongoCosta RicaCroatiaCubaCzechoslovakiaDenmarkDominicaDominican RepublicEastern AfricaEastern AsiaEastern EuropeEcuadorEgyptEl SalvadorEnglandEritreaEthiopiaEuropeFijiFranceGermanyGhanaGreeceGrenadaGuatemalaGuyanaHaitiHondurasHong KongHungaryIndiaIndonesiaIranIraqIrelandIsraelItalyJamaicaJapanJordanKazakhstanKenyaKoreaKuwaitLaosLatin AmericaLatviaLebanonLiberiaLithuaniaMalaysiaMexicoMicronesiaMiddle AfricaMoldovaMoroccoNepalNetherlandsNicaraguaNigeriaNorth AmericaNorth MacedoniaNorthern AfricaNorthern EuropeNorwayOceaniaPakistanPanamaPeruPhilippinesPolandPortugalRomaniaRussiaSaudi ArabiaScotlandSenegalSerbiaSierra LeoneSingaporeSomaliaSouth AfricaSouth AmericaSouth Central AsiaSouth Eastern AsiaSouthern EuropeSpainSri LankaSt. Vincent and the GrenadinesSudanSwedenSwitzerlandSyriaTaiwanThailandTrinidad and TobagoTurkeyUgandaUkraineUruguayUzbekistanVenezuelaVietnamWest IndiesWestern AfricaWestern AsiaWestern EuropeYemenZaireZimbabweAzores
Single Mother Households
Income
Poverty
Unemployment
Labor Participation
Family Structure
Vehicle Availability
Education Level
Disability

Single Mother Households Comparison

Austrians

Somalis

Exceptional
Tragic
5.7%
SINGLE MOTHER HOUSEHOLDS
96.4/ 100
METRIC RATING
96th/ 347
METRIC RANK
7.5%
SINGLE MOTHER HOUSEHOLDS
0.1/ 100
METRIC RATING
269th/ 347
METRIC RANK

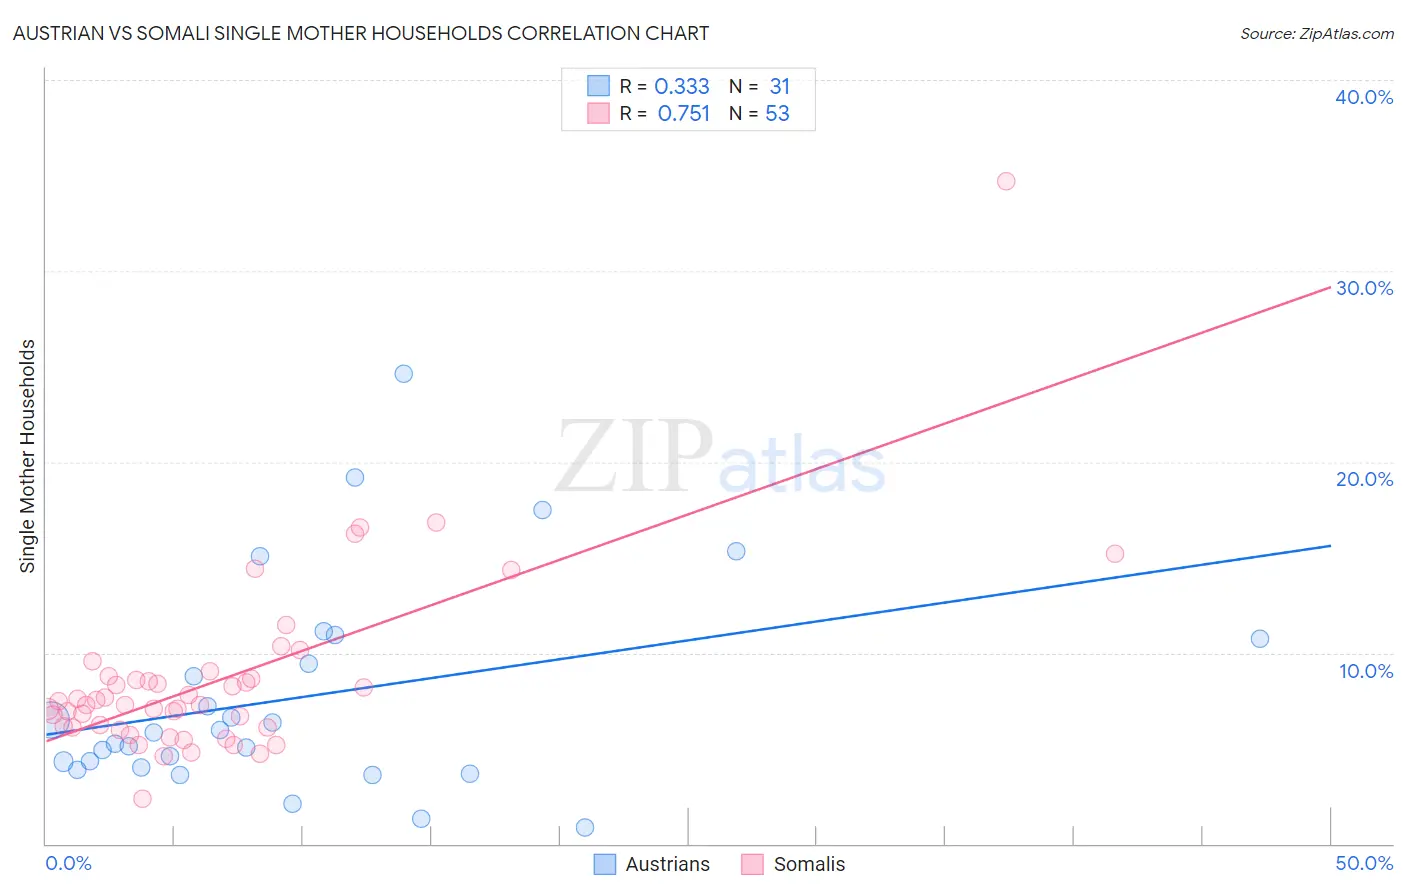
Austrian vs Somali Single Mother Households Correlation Chart

The statistical analysis conducted on geographies consisting of 449,998,235 people shows a mild positive correlation between the proportion of Austrians and percentage of single mother households in the United States with a correlation coefficient (R) of 0.333 and weighted average of 5.7%. Similarly, the statistical analysis conducted on geographies consisting of 99,265,723 people shows a strong positive correlation between the proportion of Somalis and percentage of single mother households in the United States with a correlation coefficient (R) of 0.751 and weighted average of 7.5%, a difference of 30.9%.
Austrian vs Somali Single Mother Households

Single Mother Households Correlation Summary

MeasurementAustrianSomali
Minimum0.83%2.4%
Maximum24.6%34.7%
Range23.8%32.3%
Mean7.7%8.6%
Median5.8%7.3%
Interquartile 25% (IQ1)4.0%6.1%
Interquartile 75% (IQ3)10.7%8.7%
Interquartile Range (IQR)6.7%2.6%
Standard Deviation (Sample)5.6%4.8%
Standard Deviation (Population)5.5%4.8%

Similar Demographics by Single Mother Households

Demographics Similar to Austrians by Single Mother Households

In terms of single mother households, the demographic groups most similar to Austrians are Tlingit-Haida (5.7%, a difference of 0.050%), Immigrants from South Africa (5.7%, a difference of 0.090%), Slovak (5.7%, a difference of 0.15%), Immigrants from Poland (5.8%, a difference of 0.15%), and Scandinavian (5.8%, a difference of 0.16%).
DemographicsRating | RankSingle Mother Households
Ukrainians
97.2
/100
|
#89
Exceptional
5.7%
Immigrants | Indonesia
97.2
/100
|
#90
Exceptional
5.7%
Europeans
97.0
/100
|
#91
Exceptional
5.7%
Immigrants | Western Asia
96.7
/100
|
#92
Exceptional
5.7%
Serbians
96.7
/100
|
#93
Exceptional
5.7%
Basques
96.7
/100
|
#94
Exceptional
5.7%
Slovaks
96.6
/100
|
#95
Exceptional
5.7%
Austrians
96.4
/100
|
#96
Exceptional
5.7%
Tlingit-Haida
96.4
/100
|
#97
Exceptional
5.7%
Immigrants | South Africa
96.3
/100
|
#98
Exceptional
5.7%
Immigrants | Poland
96.3
/100
|
#99
Exceptional
5.8%
Scandinavians
96.2
/100
|
#100
Exceptional
5.8%
Germans
96.2
/100
|
#101
Exceptional
5.8%
English
96.2
/100
|
#102
Exceptional
5.8%
Scottish
96.2
/100
|
#103
Exceptional
5.8%

Demographics Similar to Somalis by Single Mother Households

In terms of single mother households, the demographic groups most similar to Somalis are Immigrants from Cuba (7.5%, a difference of 0.16%), Salvadoran (7.5%, a difference of 0.25%), Immigrants from the Azores (7.5%, a difference of 0.25%), Indonesian (7.5%, a difference of 0.41%), and Blackfeet (7.5%, a difference of 0.45%).
DemographicsRating | RankSingle Mother Households
Immigrants | Somalia
0.2
/100
|
#262
Tragic
7.4%
Immigrants | Nicaragua
0.2
/100
|
#263
Tragic
7.4%
Yaqui
0.1
/100
|
#264
Tragic
7.4%
Crow
0.1
/100
|
#265
Tragic
7.4%
Nepalese
0.1
/100
|
#266
Tragic
7.5%
Blackfeet
0.1
/100
|
#267
Tragic
7.5%
Indonesians
0.1
/100
|
#268
Tragic
7.5%
Somalis
0.1
/100
|
#269
Tragic
7.5%
Immigrants | Cuba
0.1
/100
|
#270
Tragic
7.5%
Salvadorans
0.1
/100
|
#271
Tragic
7.5%
Immigrants | Azores
0.1
/100
|
#272
Tragic
7.5%
Belizeans
0.1
/100
|
#273
Tragic
7.6%
Immigrants | Guyana
0.1
/100
|
#274
Tragic
7.6%
Central American Indians
0.1
/100
|
#275
Tragic
7.6%
Guyanese
0.1
/100
|
#276
Tragic
7.6%