Immigrants from Dominica vs Puerto Rican Divorced or Separated
COMPARE
Immigrants from Dominica
Puerto Rican
Divorced or Separated
Divorced or Separated Comparison
Immigrants from Dominica
Puerto Ricans
12.6%
DIVORCED OR SEPARATED
0.5/ 100
METRIC RATING
261st/ 347
METRIC RANK
13.9%
DIVORCED OR SEPARATED
0.0/ 100
METRIC RATING
333rd/ 347
METRIC RANK
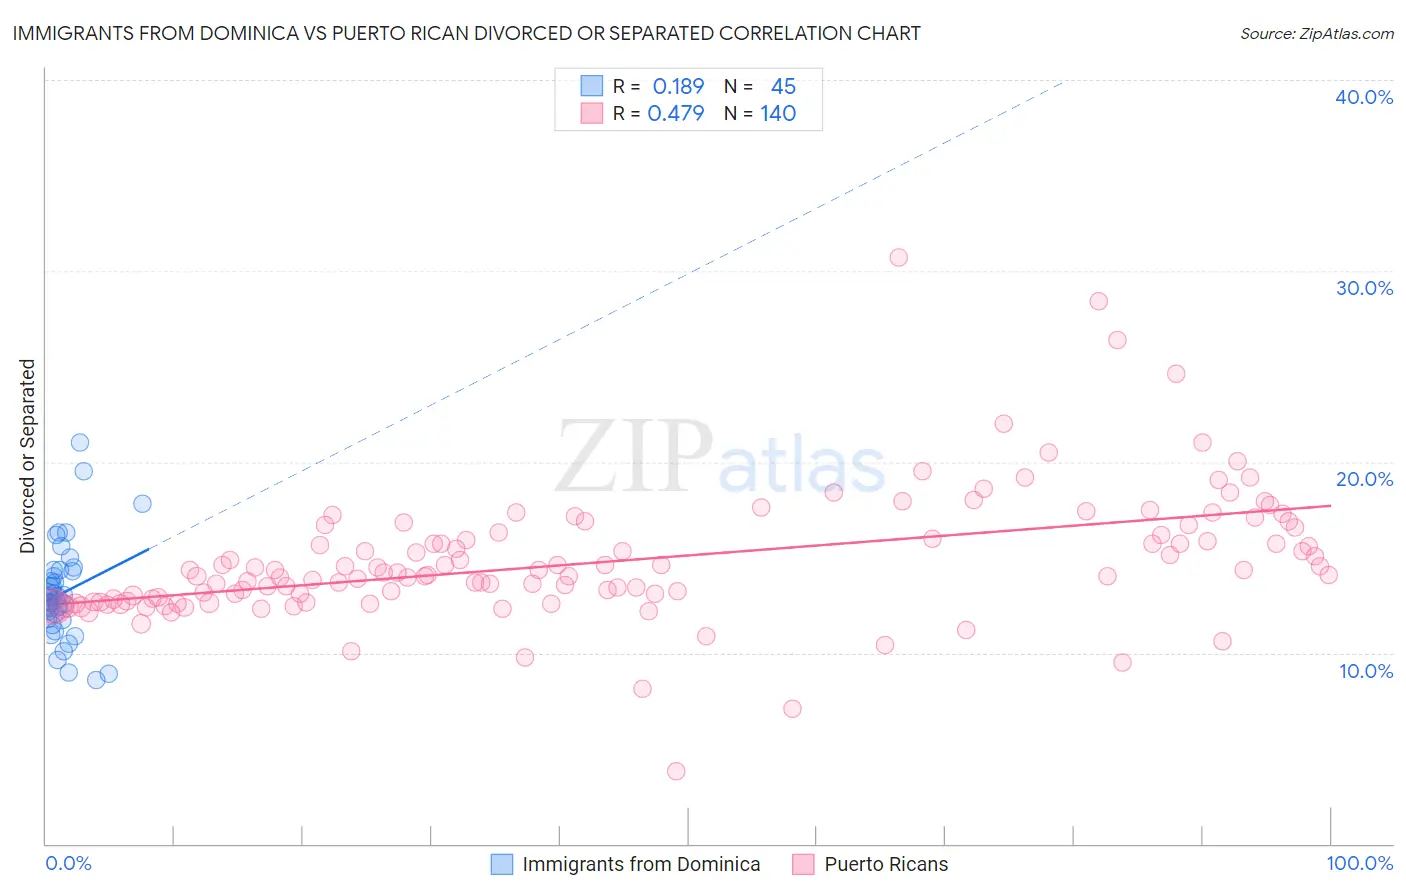
Immigrants from Dominica vs Puerto Rican Divorced or Separated Correlation Chart
The statistical analysis conducted on geographies consisting of 83,792,024 people shows a poor positive correlation between the proportion of Immigrants from Dominica and percentage of population currently divorced or separated in the United States with a correlation coefficient (R) of 0.189 and weighted average of 12.6%. Similarly, the statistical analysis conducted on geographies consisting of 527,942,852 people shows a moderate positive correlation between the proportion of Puerto Ricans and percentage of population currently divorced or separated in the United States with a correlation coefficient (R) of 0.479 and weighted average of 13.9%, a difference of 10.0%.
Divorced or Separated Correlation Summary
| Measurement | Immigrants from Dominica | Puerto Rican |
| Minimum | 8.6% | 3.8% |
| Maximum | 21.0% | 30.7% |
| Range | 12.4% | 26.9% |
| Mean | 13.1% | 14.8% |
| Median | 12.7% | 14.1% |
| Interquartile 25% (IQ1) | 11.8% | 12.7% |
| Interquartile 75% (IQ3) | 14.3% | 16.2% |
| Interquartile Range (IQR) | 2.5% | 3.5% |
| Standard Deviation (Sample) | 2.5% | 3.4% |
| Standard Deviation (Population) | 2.5% | 3.4% |
Similar Demographics by Divorced or Separated
Demographics Similar to Immigrants from Dominica by Divorced or Separated
In terms of divorced or separated, the demographic groups most similar to Immigrants from Dominica are Yuman (12.6%, a difference of 0.030%), Immigrants from Uruguay (12.6%, a difference of 0.030%), Immigrants from Somalia (12.6%, a difference of 0.050%), Indonesian (12.6%, a difference of 0.050%), and Basque (12.6%, a difference of 0.060%).
| Demographics | Rating | Rank | Divorced or Separated |
| Senegalese | 0.8 /100 | #254 | Tragic 12.6% |
| Welsh | 0.7 /100 | #255 | Tragic 12.6% |
| Immigrants | Colombia | 0.6 /100 | #256 | Tragic 12.6% |
| Immigrants | Somalia | 0.6 /100 | #257 | Tragic 12.6% |
| Indonesians | 0.6 /100 | #258 | Tragic 12.6% |
| Yuman | 0.6 /100 | #259 | Tragic 12.6% |
| Immigrants | Uruguay | 0.6 /100 | #260 | Tragic 12.6% |
| Immigrants | Dominica | 0.5 /100 | #261 | Tragic 12.6% |
| Basques | 0.5 /100 | #262 | Tragic 12.6% |
| Immigrants | Panama | 0.5 /100 | #263 | Tragic 12.6% |
| English | 0.5 /100 | #264 | Tragic 12.6% |
| Immigrants | Senegal | 0.5 /100 | #265 | Tragic 12.6% |
| Whites/Caucasians | 0.5 /100 | #266 | Tragic 12.6% |
| Scottish | 0.4 /100 | #267 | Tragic 12.6% |
| Fijians | 0.4 /100 | #268 | Tragic 12.6% |
Demographics Similar to Puerto Ricans by Divorced or Separated
In terms of divorced or separated, the demographic groups most similar to Puerto Ricans are Immigrants from Bahamas (13.9%, a difference of 0.34%), Cherokee (13.7%, a difference of 0.95%), Dutch West Indian (14.0%, a difference of 0.95%), Shoshone (14.0%, a difference of 1.3%), and Crow (14.1%, a difference of 1.6%).
| Demographics | Rating | Rank | Divorced or Separated |
| Immigrants | Congo | 0.0 /100 | #326 | Tragic 13.5% |
| Comanche | 0.0 /100 | #327 | Tragic 13.5% |
| Immigrants | Caribbean | 0.0 /100 | #328 | Tragic 13.6% |
| Houma | 0.0 /100 | #329 | Tragic 13.6% |
| Paiute | 0.0 /100 | #330 | Tragic 13.6% |
| Blacks/African Americans | 0.0 /100 | #331 | Tragic 13.6% |
| Cherokee | 0.0 /100 | #332 | Tragic 13.7% |
| Puerto Ricans | 0.0 /100 | #333 | Tragic 13.9% |
| Immigrants | Bahamas | 0.0 /100 | #334 | Tragic 13.9% |
| Dutch West Indians | 0.0 /100 | #335 | Tragic 14.0% |
| Shoshone | 0.0 /100 | #336 | Tragic 14.0% |
| Crow | 0.0 /100 | #337 | Tragic 14.1% |
| Choctaw | 0.0 /100 | #338 | Tragic 14.1% |
| Colville | 0.0 /100 | #339 | Tragic 14.2% |
| Chickasaw | 0.0 /100 | #340 | Tragic 14.2% |