Assyrian/Chaldean/Syriac vs Puerto Rican Householder Income Ages 45 - 64 years
COMPARE
Assyrian/Chaldean/Syriac
Puerto Rican
Householder Income Ages 45 - 64 years
Householder Income Ages 45 - 64 years Comparison
Assyrians/Chaldeans/Syriacs
Puerto Ricans
$110,201
HOUSEHOLDER INCOME AGES 45 - 64 YEARS
99.3/ 100
METRIC RATING
72nd/ 347
METRIC RANK
$69,234
HOUSEHOLDER INCOME AGES 45 - 64 YEARS
0.0/ 100
METRIC RATING
346th/ 347
METRIC RANK
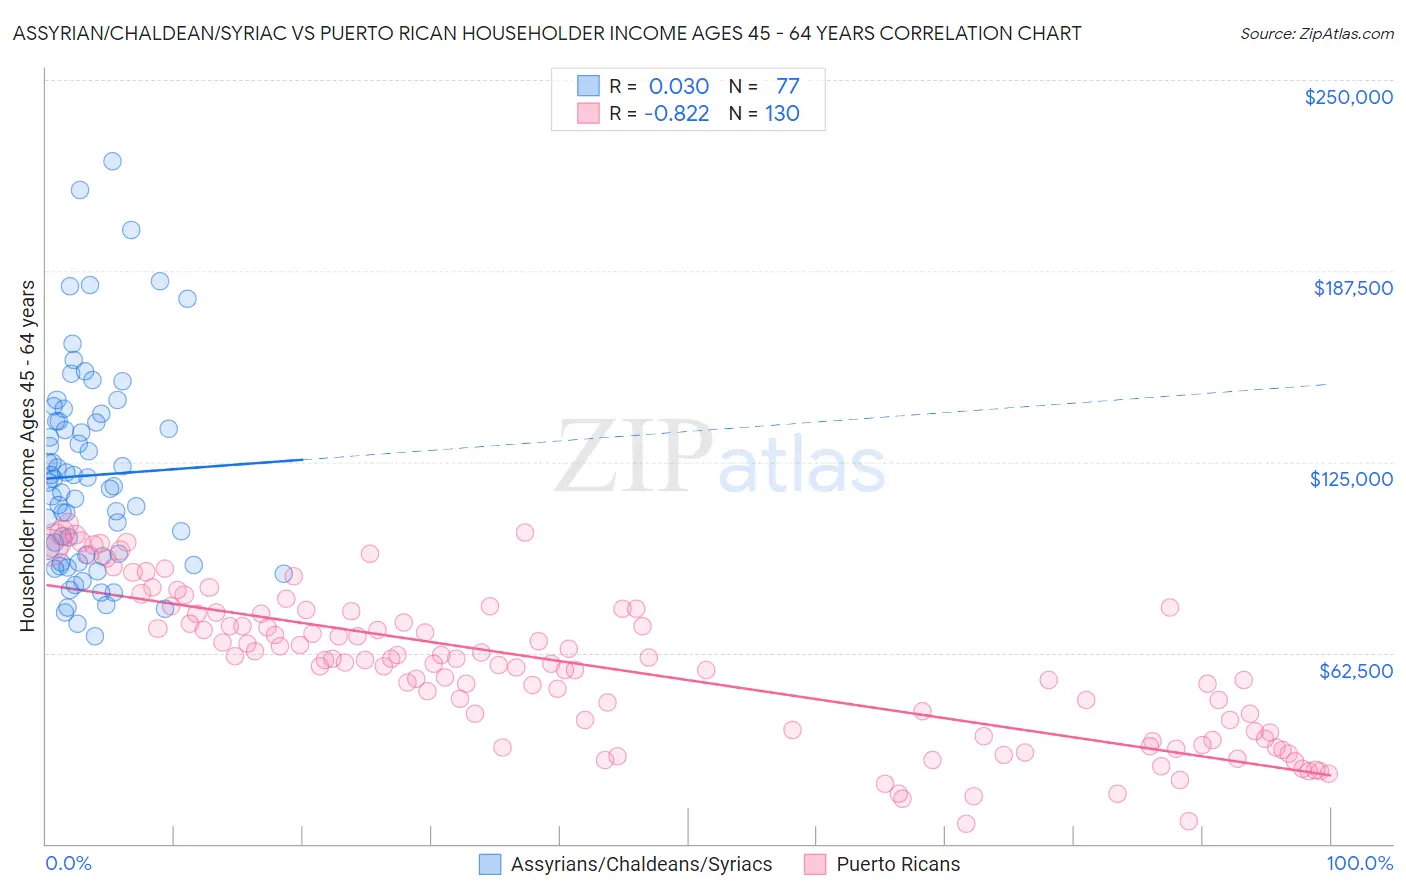
Assyrian/Chaldean/Syriac vs Puerto Rican Householder Income Ages 45 - 64 years Correlation Chart
The statistical analysis conducted on geographies consisting of 110,244,252 people shows no correlation between the proportion of Assyrians/Chaldeans/Syriacs and household income with householder between the ages 45 and 64 in the United States with a correlation coefficient (R) of 0.030 and weighted average of $110,201. Similarly, the statistical analysis conducted on geographies consisting of 526,175,846 people shows a very strong negative correlation between the proportion of Puerto Ricans and household income with householder between the ages 45 and 64 in the United States with a correlation coefficient (R) of -0.822 and weighted average of $69,234, a difference of 59.2%.
Householder Income Ages 45 - 64 years Correlation Summary
| Measurement | Assyrian/Chaldean/Syriac | Puerto Rican |
| Minimum | $67,992 | $6,600 |
| Maximum | $223,409 | $104,645 |
| Range | $155,417 | $98,045 |
| Mean | $120,547 | $58,161 |
| Median | $117,054 | $60,296 |
| Interquartile 25% (IQ1) | $93,085 | $36,266 |
| Interquartile 75% (IQ3) | $138,155 | $75,781 |
| Interquartile Range (IQR) | $45,070 | $39,515 |
| Standard Deviation (Sample) | $33,489 | $24,341 |
| Standard Deviation (Population) | $33,271 | $24,247 |
Similar Demographics by Householder Income Ages 45 - 64 years
Demographics Similar to Assyrians/Chaldeans/Syriacs by Householder Income Ages 45 - 64 years
In terms of householder income ages 45 - 64 years, the demographic groups most similar to Assyrians/Chaldeans/Syriacs are Italian ($110,224, a difference of 0.020%), Argentinean ($110,103, a difference of 0.090%), Korean ($110,334, a difference of 0.12%), Immigrants from Italy ($110,434, a difference of 0.21%), and Immigrants from Egypt ($109,941, a difference of 0.24%).
| Demographics | Rating | Rank | Householder Income Ages 45 - 64 years |
| Immigrants | Belarus | 99.6 /100 | #65 | Exceptional $111,430 |
| New Zealanders | 99.6 /100 | #66 | Exceptional $111,286 |
| Laotians | 99.5 /100 | #67 | Exceptional $111,051 |
| Immigrants | Romania | 99.4 /100 | #68 | Exceptional $110,633 |
| Immigrants | Italy | 99.4 /100 | #69 | Exceptional $110,434 |
| Koreans | 99.3 /100 | #70 | Exceptional $110,334 |
| Italians | 99.3 /100 | #71 | Exceptional $110,224 |
| Assyrians/Chaldeans/Syriacs | 99.3 /100 | #72 | Exceptional $110,201 |
| Argentineans | 99.3 /100 | #73 | Exceptional $110,103 |
| Immigrants | Egypt | 99.2 /100 | #74 | Exceptional $109,941 |
| South Africans | 99.1 /100 | #75 | Exceptional $109,719 |
| Paraguayans | 99.0 /100 | #76 | Exceptional $109,447 |
| Immigrants | England | 99.0 /100 | #77 | Exceptional $109,446 |
| Immigrants | Canada | 99.0 /100 | #78 | Exceptional $109,402 |
| Immigrants | Bulgaria | 98.9 /100 | #79 | Exceptional $109,379 |
Demographics Similar to Puerto Ricans by Householder Income Ages 45 - 64 years
In terms of householder income ages 45 - 64 years, the demographic groups most similar to Puerto Ricans are Navajo ($69,759, a difference of 0.76%), Houma ($72,093, a difference of 4.1%), Pima ($73,365, a difference of 6.0%), Lumbee ($65,113, a difference of 6.3%), and Tohono O'odham ($73,774, a difference of 6.6%).
| Demographics | Rating | Rank | Householder Income Ages 45 - 64 years |
| Immigrants | Congo | 0.0 /100 | #333 | Tragic $77,850 |
| Menominee | 0.0 /100 | #334 | Tragic $76,903 |
| Cheyenne | 0.0 /100 | #335 | Tragic $76,362 |
| Arapaho | 0.0 /100 | #336 | Tragic $75,945 |
| Pueblo | 0.0 /100 | #337 | Tragic $75,601 |
| Hopi | 0.0 /100 | #338 | Tragic $75,562 |
| Kiowa | 0.0 /100 | #339 | Tragic $74,815 |
| Immigrants | Yemen | 0.0 /100 | #340 | Tragic $74,575 |
| Crow | 0.0 /100 | #341 | Tragic $74,257 |
| Tohono O'odham | 0.0 /100 | #342 | Tragic $73,774 |
| Pima | 0.0 /100 | #343 | Tragic $73,365 |
| Houma | 0.0 /100 | #344 | Tragic $72,093 |
| Navajo | 0.0 /100 | #345 | Tragic $69,759 |
| Puerto Ricans | 0.0 /100 | #346 | Tragic $69,234 |
| Lumbee | 0.0 /100 | #347 | Tragic $65,113 |