Assyrian/Chaldean/Syriac vs Immigrants from Kuwait Average Family Size
COMPARE
Assyrian/Chaldean/Syriac
Immigrants from Kuwait
Average Family Size
Average Family Size Comparison
Assyrians/Chaldeans/Syriacs
Immigrants from Kuwait
3.24
AVERAGE FAMILY SIZE
73.8/ 100
METRIC RATING
149th/ 347
METRIC RANK
3.19
AVERAGE FAMILY SIZE
7.2/ 100
METRIC RATING
222nd/ 347
METRIC RANK
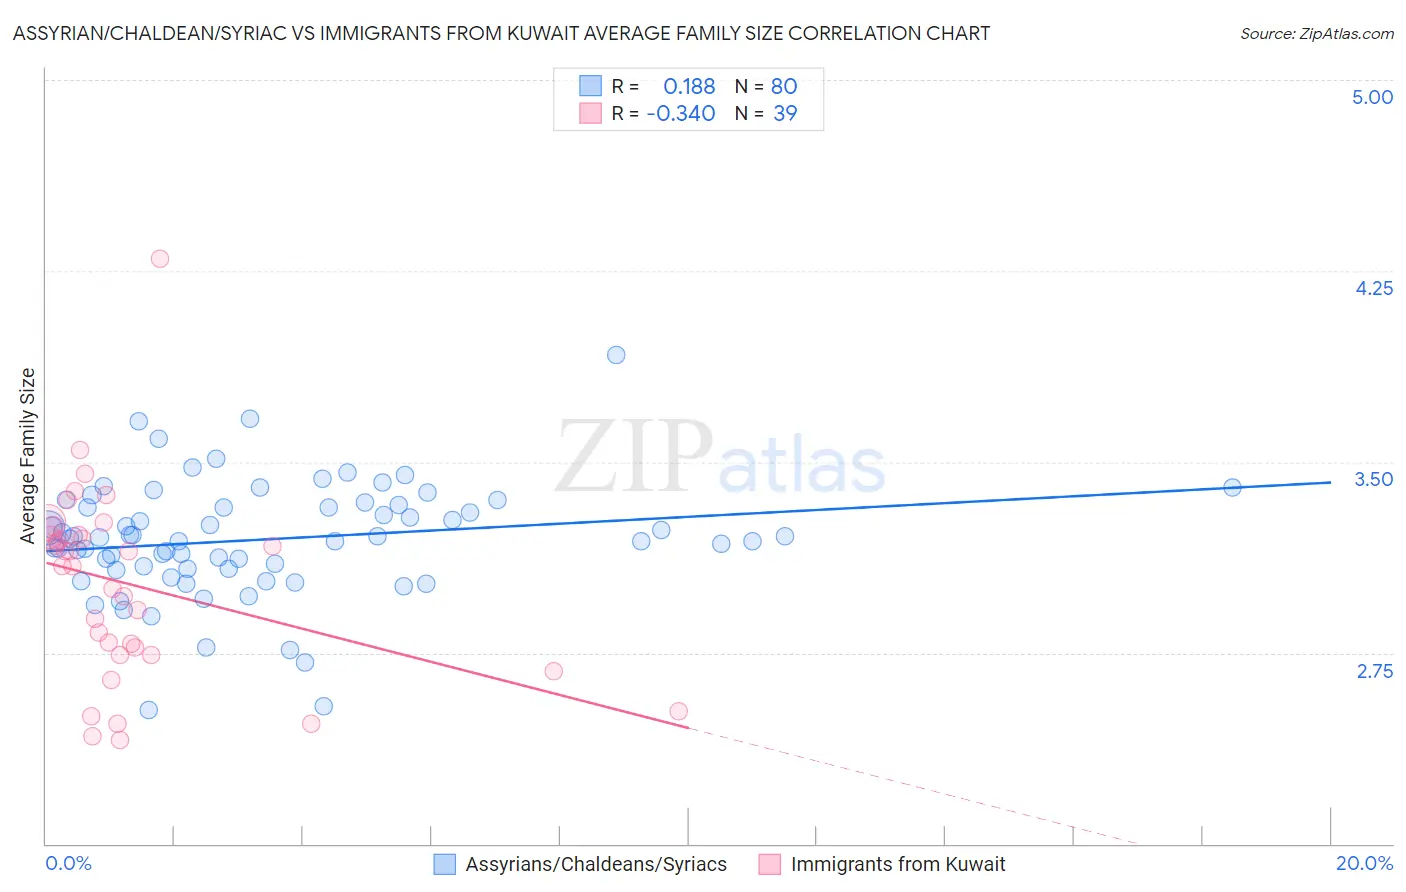
Assyrian/Chaldean/Syriac vs Immigrants from Kuwait Average Family Size Correlation Chart
The statistical analysis conducted on geographies consisting of 110,294,582 people shows a poor positive correlation between the proportion of Assyrians/Chaldeans/Syriacs and average family size in the United States with a correlation coefficient (R) of 0.188 and weighted average of 3.24. Similarly, the statistical analysis conducted on geographies consisting of 136,887,006 people shows a mild negative correlation between the proportion of Immigrants from Kuwait and average family size in the United States with a correlation coefficient (R) of -0.340 and weighted average of 3.19, a difference of 1.7%.
Average Family Size Correlation Summary
| Measurement | Assyrian/Chaldean/Syriac | Immigrants from Kuwait |
| Minimum | 2.52 | 2.41 |
| Maximum | 3.92 | 4.30 |
| Range | 1.40 | 1.89 |
| Mean | 3.20 | 3.02 |
| Median | 3.20 | 3.09 |
| Interquartile 25% (IQ1) | 3.08 | 2.74 |
| Interquartile 75% (IQ3) | 3.33 | 3.21 |
| Interquartile Range (IQR) | 0.25 | 0.47 |
| Standard Deviation (Sample) | 0.23 | 0.38 |
| Standard Deviation (Population) | 0.23 | 0.37 |
Similar Demographics by Average Family Size
Demographics Similar to Assyrians/Chaldeans/Syriacs by Average Family Size
In terms of average family size, the demographic groups most similar to Assyrians/Chaldeans/Syriacs are Indian (Asian) (3.24, a difference of 0.0%), Jordanian (3.24, a difference of 0.010%), Blackfeet (3.24, a difference of 0.030%), Spanish American (3.24, a difference of 0.030%), and Immigrants from Jordan (3.24, a difference of 0.050%).
| Demographics | Rating | Rank | Average Family Size |
| Liberians | 81.2 /100 | #142 | Excellent 3.25 |
| Bhutanese | 81.0 /100 | #143 | Excellent 3.25 |
| Tsimshian | 80.2 /100 | #144 | Excellent 3.25 |
| Armenians | 78.2 /100 | #145 | Good 3.25 |
| Immigrants | Africa | 77.9 /100 | #146 | Good 3.25 |
| Immigrants | Jordan | 75.7 /100 | #147 | Good 3.24 |
| Blackfeet | 75.0 /100 | #148 | Good 3.24 |
| Assyrians/Chaldeans/Syriacs | 73.8 /100 | #149 | Good 3.24 |
| Indians (Asian) | 73.6 /100 | #150 | Good 3.24 |
| Jordanians | 73.5 /100 | #151 | Good 3.24 |
| Spanish Americans | 72.5 /100 | #152 | Good 3.24 |
| Immigrants | Eritrea | 71.4 /100 | #153 | Good 3.24 |
| Immigrants | Egypt | 70.0 /100 | #154 | Good 3.24 |
| Seminole | 68.2 /100 | #155 | Good 3.24 |
| Immigrants | Taiwan | 68.1 /100 | #156 | Good 3.24 |
Demographics Similar to Immigrants from Kuwait by Average Family Size
In terms of average family size, the demographic groups most similar to Immigrants from Kuwait are Immigrants from Ukraine (3.19, a difference of 0.0%), Immigrants from Zimbabwe (3.19, a difference of 0.010%), Syrian (3.19, a difference of 0.050%), Cree (3.19, a difference of 0.070%), and Chickasaw (3.19, a difference of 0.090%).
| Demographics | Rating | Rank | Average Family Size |
| Delaware | 11.1 /100 | #215 | Poor 3.20 |
| Bermudans | 11.0 /100 | #216 | Poor 3.20 |
| Immigrants | Somalia | 10.3 /100 | #217 | Poor 3.20 |
| French American Indians | 9.8 /100 | #218 | Tragic 3.20 |
| Pennsylvania Germans | 9.3 /100 | #219 | Tragic 3.19 |
| Lebanese | 9.1 /100 | #220 | Tragic 3.19 |
| Immigrants | Ukraine | 7.2 /100 | #221 | Tragic 3.19 |
| Immigrants | Kuwait | 7.2 /100 | #222 | Tragic 3.19 |
| Immigrants | Zimbabwe | 7.1 /100 | #223 | Tragic 3.19 |
| Syrians | 6.5 /100 | #224 | Tragic 3.19 |
| Cree | 6.2 /100 | #225 | Tragic 3.19 |
| Chickasaw | 6.0 /100 | #226 | Tragic 3.19 |
| Portuguese | 6.0 /100 | #227 | Tragic 3.19 |
| Immigrants | Nonimmigrants | 5.7 /100 | #228 | Tragic 3.19 |
| Immigrants | Italy | 5.3 /100 | #229 | Tragic 3.19 |