Assyrian/Chaldean/Syriac vs Shoshone Average Family Size
COMPARE
Assyrian/Chaldean/Syriac
Shoshone
Average Family Size
Average Family Size Comparison
Assyrians/Chaldeans/Syriacs
Shoshone
3.24
AVERAGE FAMILY SIZE
73.8/ 100
METRIC RATING
149th/ 347
METRIC RANK
3.37
AVERAGE FAMILY SIZE
100.0/ 100
METRIC RATING
45th/ 347
METRIC RANK
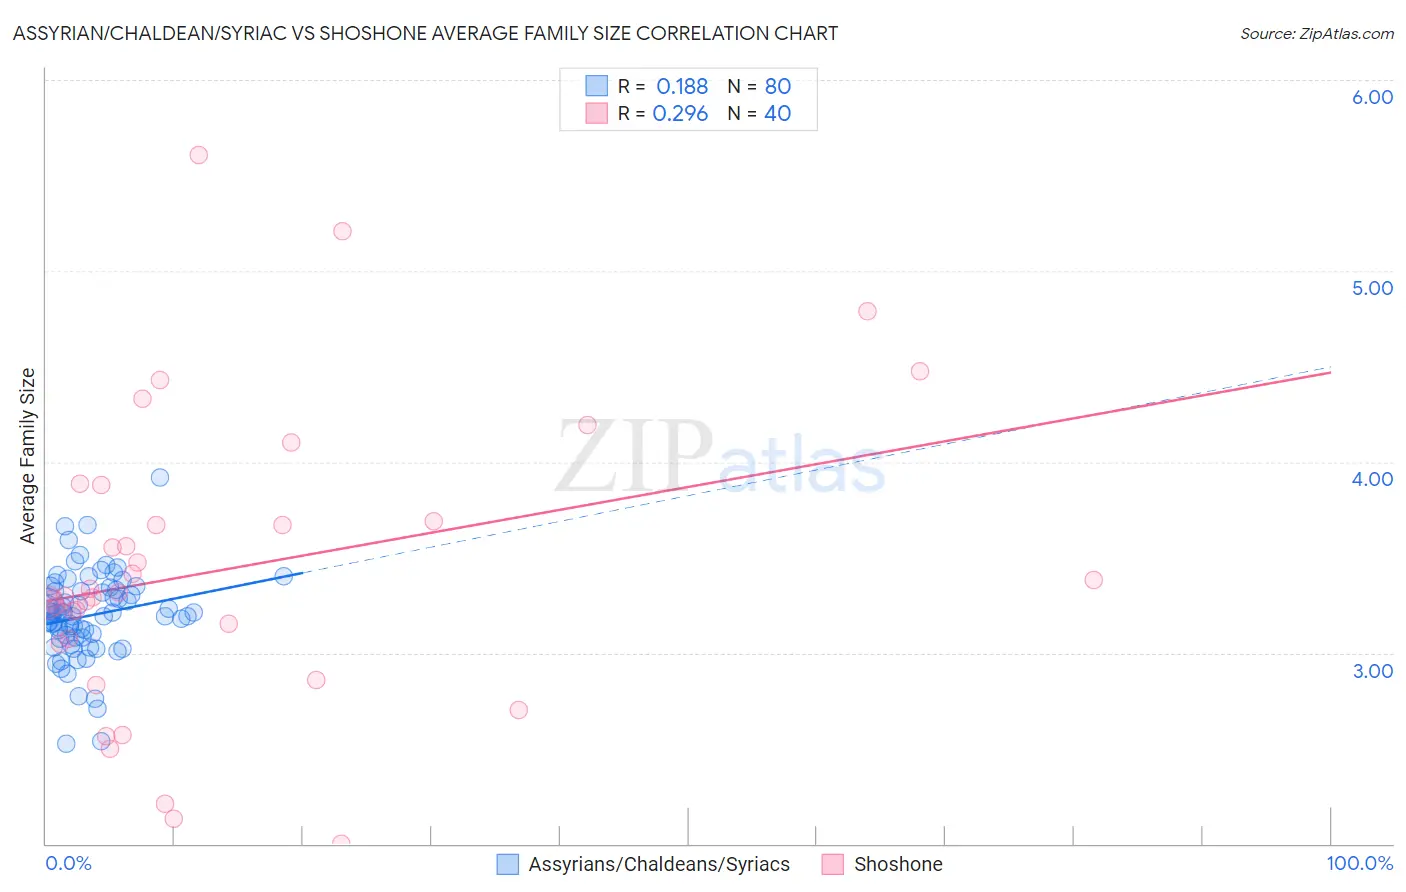
Assyrian/Chaldean/Syriac vs Shoshone Average Family Size Correlation Chart
The statistical analysis conducted on geographies consisting of 110,294,582 people shows a poor positive correlation between the proportion of Assyrians/Chaldeans/Syriacs and average family size in the United States with a correlation coefficient (R) of 0.188 and weighted average of 3.24. Similarly, the statistical analysis conducted on geographies consisting of 66,616,007 people shows a weak positive correlation between the proportion of Shoshone and average family size in the United States with a correlation coefficient (R) of 0.296 and weighted average of 3.37, a difference of 4.0%.
Average Family Size Correlation Summary
| Measurement | Assyrian/Chaldean/Syriac | Shoshone |
| Minimum | 2.52 | 2.00 |
| Maximum | 3.92 | 5.61 |
| Range | 1.40 | 3.61 |
| Mean | 3.20 | 3.44 |
| Median | 3.20 | 3.31 |
| Interquartile 25% (IQ1) | 3.08 | 3.06 |
| Interquartile 75% (IQ3) | 3.33 | 3.79 |
| Interquartile Range (IQR) | 0.25 | 0.72 |
| Standard Deviation (Sample) | 0.23 | 0.78 |
| Standard Deviation (Population) | 0.23 | 0.77 |
Similar Demographics by Average Family Size
Demographics Similar to Assyrians/Chaldeans/Syriacs by Average Family Size
In terms of average family size, the demographic groups most similar to Assyrians/Chaldeans/Syriacs are Indian (Asian) (3.24, a difference of 0.0%), Jordanian (3.24, a difference of 0.010%), Blackfeet (3.24, a difference of 0.030%), Spanish American (3.24, a difference of 0.030%), and Immigrants from Jordan (3.24, a difference of 0.050%).
| Demographics | Rating | Rank | Average Family Size |
| Liberians | 81.2 /100 | #142 | Excellent 3.25 |
| Bhutanese | 81.0 /100 | #143 | Excellent 3.25 |
| Tsimshian | 80.2 /100 | #144 | Excellent 3.25 |
| Armenians | 78.2 /100 | #145 | Good 3.25 |
| Immigrants | Africa | 77.9 /100 | #146 | Good 3.25 |
| Immigrants | Jordan | 75.7 /100 | #147 | Good 3.24 |
| Blackfeet | 75.0 /100 | #148 | Good 3.24 |
| Assyrians/Chaldeans/Syriacs | 73.8 /100 | #149 | Good 3.24 |
| Indians (Asian) | 73.6 /100 | #150 | Good 3.24 |
| Jordanians | 73.5 /100 | #151 | Good 3.24 |
| Spanish Americans | 72.5 /100 | #152 | Good 3.24 |
| Immigrants | Eritrea | 71.4 /100 | #153 | Good 3.24 |
| Immigrants | Egypt | 70.0 /100 | #154 | Good 3.24 |
| Seminole | 68.2 /100 | #155 | Good 3.24 |
| Immigrants | Taiwan | 68.1 /100 | #156 | Good 3.24 |
Demographics Similar to Shoshone by Average Family Size
In terms of average family size, the demographic groups most similar to Shoshone are Alaska Native (3.37, a difference of 0.030%), Immigrants from Philippines (3.37, a difference of 0.040%), Haitian (3.37, a difference of 0.060%), Vietnamese (3.37, a difference of 0.10%), and Immigrants from Nicaragua (3.37, a difference of 0.10%).
| Demographics | Rating | Rank | Average Family Size |
| Immigrants | Belize | 100.0 /100 | #38 | Exceptional 3.39 |
| Immigrants | Haiti | 100.0 /100 | #39 | Exceptional 3.39 |
| Belizeans | 100.0 /100 | #40 | Exceptional 3.39 |
| Marshallese | 100.0 /100 | #41 | Exceptional 3.38 |
| Immigrants | Vietnam | 100.0 /100 | #42 | Exceptional 3.38 |
| Immigrants | Philippines | 100.0 /100 | #43 | Exceptional 3.37 |
| Alaska Natives | 100.0 /100 | #44 | Exceptional 3.37 |
| Shoshone | 100.0 /100 | #45 | Exceptional 3.37 |
| Haitians | 100.0 /100 | #46 | Exceptional 3.37 |
| Vietnamese | 100.0 /100 | #47 | Exceptional 3.37 |
| Immigrants | Nicaragua | 100.0 /100 | #48 | Exceptional 3.37 |
| Bangladeshis | 100.0 /100 | #49 | Exceptional 3.37 |
| Immigrants | Bangladesh | 100.0 /100 | #50 | Exceptional 3.36 |
| Nicaraguans | 100.0 /100 | #51 | Exceptional 3.36 |
| Fijians | 100.0 /100 | #52 | Exceptional 3.36 |