Assyrian/Chaldean/Syriac vs Immigrants from Albania No Schooling Completed
COMPARE
Assyrian/Chaldean/Syriac
Immigrants from Albania
No Schooling Completed
No Schooling Completed Comparison
Assyrians/Chaldeans/Syriacs
Immigrants from Albania
2.5%
NO SCHOOLING COMPLETED
0.6/ 100
METRIC RATING
258th/ 347
METRIC RANK
2.2%
NO SCHOOLING COMPLETED
28.3/ 100
METRIC RATING
194th/ 347
METRIC RANK
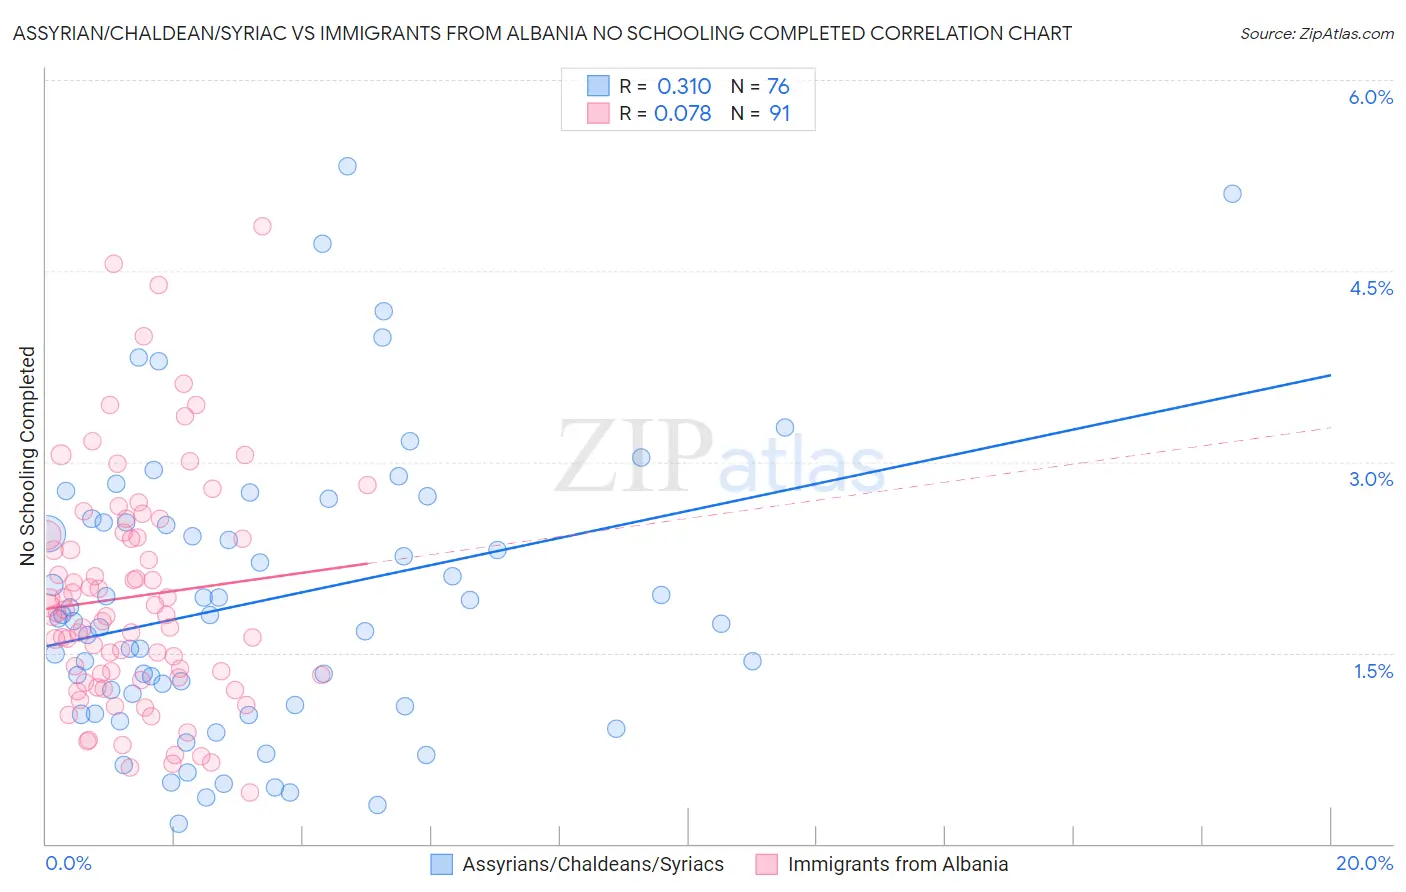
Assyrian/Chaldean/Syriac vs Immigrants from Albania No Schooling Completed Correlation Chart
The statistical analysis conducted on geographies consisting of 110,066,308 people shows a mild positive correlation between the proportion of Assyrians/Chaldeans/Syriacs and percentage of population with no schooling in the United States with a correlation coefficient (R) of 0.310 and weighted average of 2.5%. Similarly, the statistical analysis conducted on geographies consisting of 118,975,622 people shows a slight positive correlation between the proportion of Immigrants from Albania and percentage of population with no schooling in the United States with a correlation coefficient (R) of 0.078 and weighted average of 2.2%, a difference of 13.7%.
No Schooling Completed Correlation Summary
| Measurement | Assyrian/Chaldean/Syriac | Immigrants from Albania |
| Minimum | 0.15% | 0.40% |
| Maximum | 5.3% | 4.9% |
| Range | 5.2% | 4.5% |
| Mean | 1.9% | 1.9% |
| Median | 1.8% | 1.8% |
| Interquartile 25% (IQ1) | 1.1% | 1.3% |
| Interquartile 75% (IQ3) | 2.5% | 2.4% |
| Interquartile Range (IQR) | 1.4% | 1.1% |
| Standard Deviation (Sample) | 1.1% | 0.91% |
| Standard Deviation (Population) | 1.1% | 0.90% |
Similar Demographics by No Schooling Completed
Demographics Similar to Assyrians/Chaldeans/Syriacs by No Schooling Completed
In terms of no schooling completed, the demographic groups most similar to Assyrians/Chaldeans/Syriacs are Immigrants from South America (2.5%, a difference of 0.030%), Immigrants from Jamaica (2.5%, a difference of 0.060%), Immigrants from Ethiopia (2.5%, a difference of 0.11%), Armenian (2.5%, a difference of 0.23%), and Immigrants from Sierra Leone (2.5%, a difference of 0.58%).
| Demographics | Rating | Rank | No Schooling Completed |
| Immigrants | Africa | 1.1 /100 | #251 | Tragic 2.4% |
| Immigrants | Colombia | 1.0 /100 | #252 | Tragic 2.4% |
| Immigrants | Asia | 0.9 /100 | #253 | Tragic 2.4% |
| Immigrants | Eastern Africa | 0.9 /100 | #254 | Tragic 2.4% |
| Ethiopians | 0.8 /100 | #255 | Tragic 2.4% |
| Yaqui | 0.8 /100 | #256 | Tragic 2.4% |
| Immigrants | South America | 0.6 /100 | #257 | Tragic 2.5% |
| Assyrians/Chaldeans/Syriacs | 0.6 /100 | #258 | Tragic 2.5% |
| Immigrants | Jamaica | 0.6 /100 | #259 | Tragic 2.5% |
| Immigrants | Ethiopia | 0.6 /100 | #260 | Tragic 2.5% |
| Armenians | 0.5 /100 | #261 | Tragic 2.5% |
| Immigrants | Sierra Leone | 0.5 /100 | #262 | Tragic 2.5% |
| Immigrants | Liberia | 0.4 /100 | #263 | Tragic 2.5% |
| Indians (Asian) | 0.4 /100 | #264 | Tragic 2.5% |
| West Indians | 0.4 /100 | #265 | Tragic 2.5% |
Demographics Similar to Immigrants from Albania by No Schooling Completed
In terms of no schooling completed, the demographic groups most similar to Immigrants from Albania are Paraguayan (2.2%, a difference of 0.17%), Hawaiian (2.2%, a difference of 0.20%), Guamanian/Chamorro (2.2%, a difference of 0.24%), Immigrants from Ukraine (2.2%, a difference of 0.35%), and Bermudan (2.1%, a difference of 0.38%).
| Demographics | Rating | Rank | No Schooling Completed |
| Navajo | 36.5 /100 | #187 | Fair 2.1% |
| Immigrants | Kenya | 36.2 /100 | #188 | Fair 2.1% |
| Immigrants | Egypt | 36.1 /100 | #189 | Fair 2.1% |
| Spanish Americans | 32.6 /100 | #190 | Fair 2.1% |
| Bermudans | 30.7 /100 | #191 | Fair 2.1% |
| Guamanians/Chamorros | 29.8 /100 | #192 | Fair 2.2% |
| Paraguayans | 29.3 /100 | #193 | Fair 2.2% |
| Immigrants | Albania | 28.3 /100 | #194 | Fair 2.2% |
| Hawaiians | 27.0 /100 | #195 | Fair 2.2% |
| Immigrants | Ukraine | 26.1 /100 | #196 | Fair 2.2% |
| Immigrants | Southern Europe | 23.8 /100 | #197 | Fair 2.2% |
| Immigrants | Chile | 22.7 /100 | #198 | Fair 2.2% |
| Africans | 21.8 /100 | #199 | Fair 2.2% |
| Immigrants | Northern Africa | 19.5 /100 | #200 | Poor 2.2% |
| Costa Ricans | 17.1 /100 | #201 | Poor 2.2% |