Israeli vs African Single Mother Households
COMPARE
Israeli
African
Single Mother Households
Single Mother Households Comparison
Israelis
Africans
5.7%
SINGLE MOTHER HOUSEHOLDS
97.4/ 100
METRIC RATING
88th/ 347
METRIC RANK
8.2%
SINGLE MOTHER HOUSEHOLDS
0.0/ 100
METRIC RATING
316th/ 347
METRIC RANK
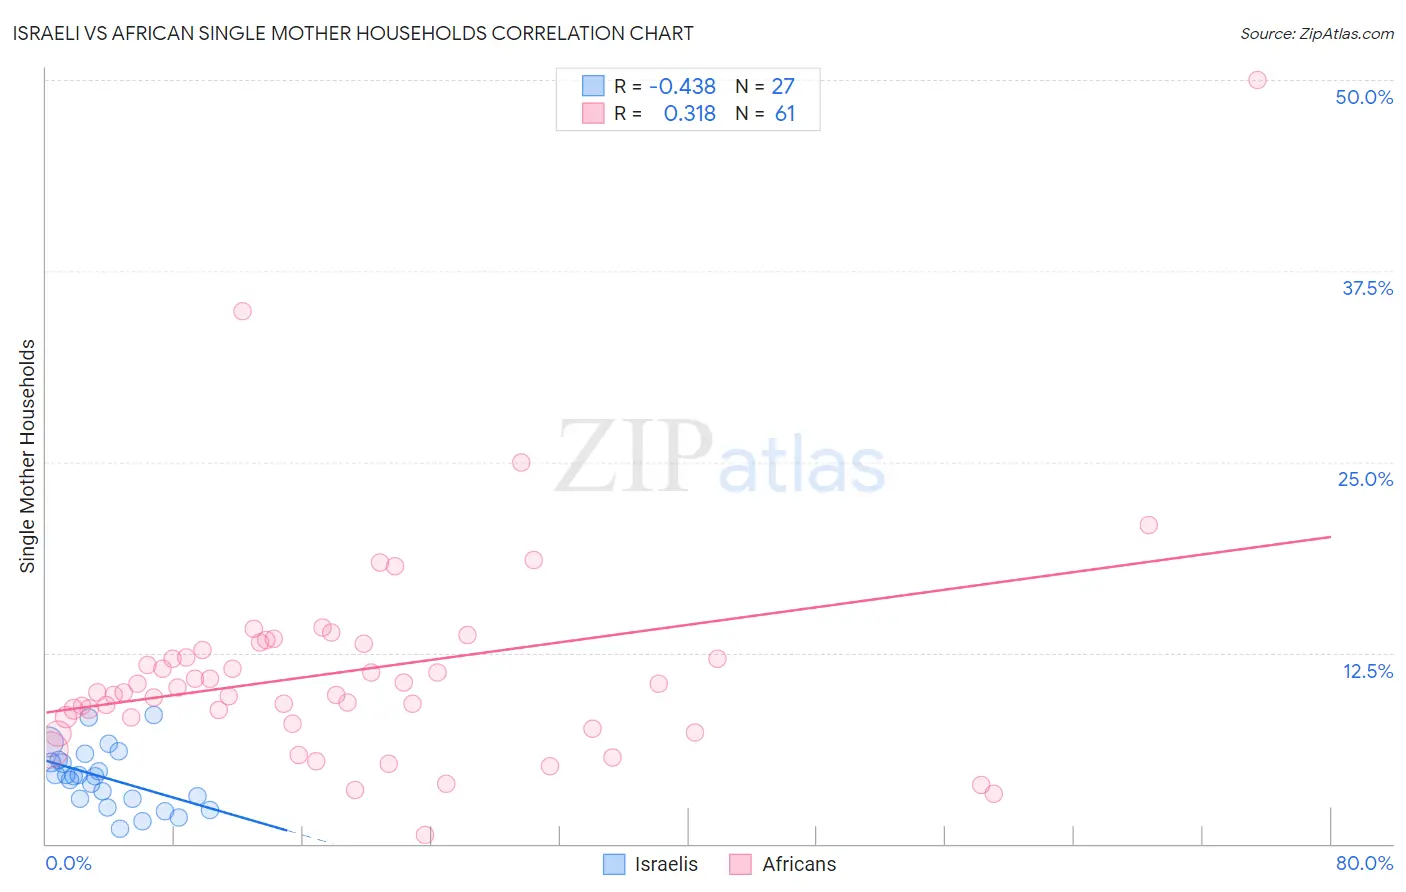
Israeli vs African Single Mother Households Correlation Chart
The statistical analysis conducted on geographies consisting of 210,568,675 people shows a moderate negative correlation between the proportion of Israelis and percentage of single mother households in the United States with a correlation coefficient (R) of -0.438 and weighted average of 5.7%. Similarly, the statistical analysis conducted on geographies consisting of 468,558,446 people shows a mild positive correlation between the proportion of Africans and percentage of single mother households in the United States with a correlation coefficient (R) of 0.318 and weighted average of 8.2%, a difference of 43.9%.
Single Mother Households Correlation Summary
| Measurement | Israeli | African |
| Minimum | 0.95% | 0.60% |
| Maximum | 8.5% | 50.0% |
| Range | 7.5% | 49.4% |
| Mean | 4.3% | 11.3% |
| Median | 4.4% | 9.9% |
| Interquartile 25% (IQ1) | 3.0% | 8.1% |
| Interquartile 75% (IQ3) | 5.5% | 12.9% |
| Interquartile Range (IQR) | 2.6% | 4.8% |
| Standard Deviation (Sample) | 1.9% | 7.3% |
| Standard Deviation (Population) | 1.9% | 7.3% |
Similar Demographics by Single Mother Households
Demographics Similar to Israelis by Single Mother Households
In terms of single mother households, the demographic groups most similar to Israelis are Immigrants from Turkey (5.7%, a difference of 0.070%), Finnish (5.7%, a difference of 0.15%), Hungarian (5.7%, a difference of 0.18%), Ukrainian (5.7%, a difference of 0.26%), and Immigrants from Indonesia (5.7%, a difference of 0.32%).
| Demographics | Rating | Rank | Single Mother Households |
| Immigrants | Moldova | 97.9 /100 | #81 | Exceptional 5.6% |
| Immigrants | Malaysia | 97.8 /100 | #82 | Exceptional 5.7% |
| Immigrants | Hungary | 97.8 /100 | #83 | Exceptional 5.7% |
| Carpatho Rusyns | 97.7 /100 | #84 | Exceptional 5.7% |
| Hungarians | 97.6 /100 | #85 | Exceptional 5.7% |
| Finns | 97.6 /100 | #86 | Exceptional 5.7% |
| Immigrants | Turkey | 97.5 /100 | #87 | Exceptional 5.7% |
| Israelis | 97.4 /100 | #88 | Exceptional 5.7% |
| Ukrainians | 97.2 /100 | #89 | Exceptional 5.7% |
| Immigrants | Indonesia | 97.2 /100 | #90 | Exceptional 5.7% |
| Europeans | 97.0 /100 | #91 | Exceptional 5.7% |
| Immigrants | Western Asia | 96.7 /100 | #92 | Exceptional 5.7% |
| Serbians | 96.7 /100 | #93 | Exceptional 5.7% |
| Basques | 96.7 /100 | #94 | Exceptional 5.7% |
| Slovaks | 96.6 /100 | #95 | Exceptional 5.7% |
Demographics Similar to Africans by Single Mother Households
In terms of single mother households, the demographic groups most similar to Africans are Immigrants from Honduras (8.2%, a difference of 0.14%), Immigrants from Western Africa (8.2%, a difference of 0.15%), Immigrants from Mexico (8.2%, a difference of 0.17%), Immigrants from Grenada (8.2%, a difference of 0.29%), and Bangladeshi (8.1%, a difference of 0.46%).
| Demographics | Rating | Rank | Single Mother Households |
| Cheyenne | 0.0 /100 | #309 | Tragic 8.1% |
| Hondurans | 0.0 /100 | #310 | Tragic 8.1% |
| Immigrants | Congo | 0.0 /100 | #311 | Tragic 8.1% |
| Bangladeshis | 0.0 /100 | #312 | Tragic 8.1% |
| Immigrants | Grenada | 0.0 /100 | #313 | Tragic 8.2% |
| Immigrants | Mexico | 0.0 /100 | #314 | Tragic 8.2% |
| Immigrants | Western Africa | 0.0 /100 | #315 | Tragic 8.2% |
| Africans | 0.0 /100 | #316 | Tragic 8.2% |
| Immigrants | Honduras | 0.0 /100 | #317 | Tragic 8.2% |
| Senegalese | 0.0 /100 | #318 | Tragic 8.2% |
| Jamaicans | 0.0 /100 | #319 | Tragic 8.2% |
| Bahamians | 0.0 /100 | #320 | Tragic 8.3% |
| Immigrants | Senegal | 0.0 /100 | #321 | Tragic 8.3% |
| Pima | 0.0 /100 | #322 | Tragic 8.3% |
| Haitians | 0.0 /100 | #323 | Tragic 8.3% |