Asian vs Immigrants from Eastern Europe Unemployment Among Ages 16 to 19 years
COMPARE
Asian
Immigrants from Eastern Europe
Unemployment Among Ages 16 to 19 years
Unemployment Among Ages 16 to 19 years Comparison
Asians
Immigrants from Eastern Europe
16.9%
UNEMPLOYMENT AMONG AGES 16 TO 19 YEARS
96.6/ 100
METRIC RATING
90th/ 347
METRIC RANK
17.8%
UNEMPLOYMENT AMONG AGES 16 TO 19 YEARS
23.6/ 100
METRIC RATING
203rd/ 347
METRIC RANK
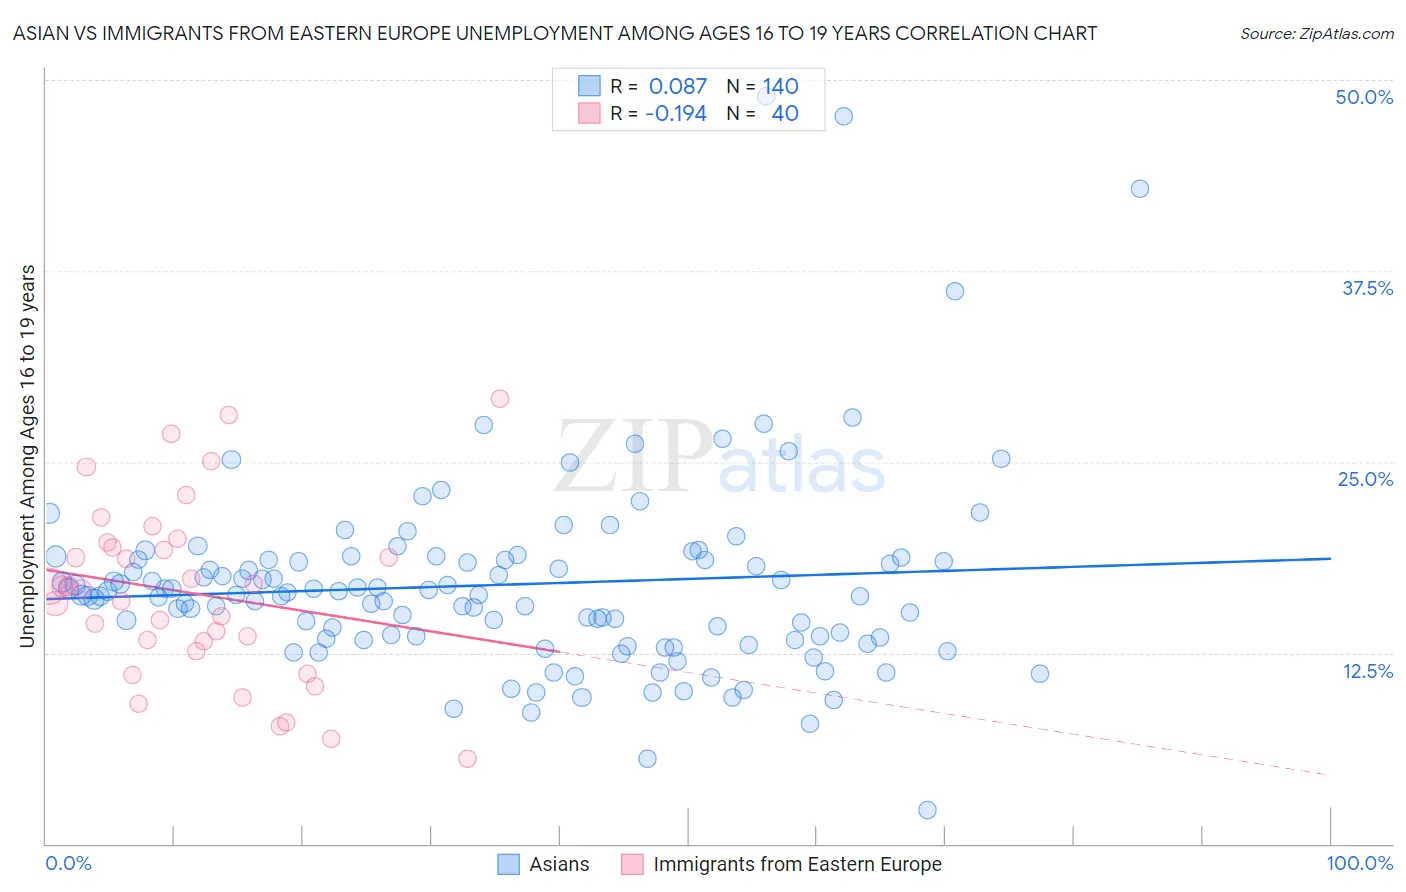
Asian vs Immigrants from Eastern Europe Unemployment Among Ages 16 to 19 years Correlation Chart
The statistical analysis conducted on geographies consisting of 499,790,335 people shows a slight positive correlation between the proportion of Asians and unemployment rate among population between the ages 16 and 19 in the United States with a correlation coefficient (R) of 0.087 and weighted average of 16.9%. Similarly, the statistical analysis conducted on geographies consisting of 442,703,525 people shows a poor negative correlation between the proportion of Immigrants from Eastern Europe and unemployment rate among population between the ages 16 and 19 in the United States with a correlation coefficient (R) of -0.194 and weighted average of 17.8%, a difference of 5.5%.
Unemployment Among Ages 16 to 19 years Correlation Summary
| Measurement | Asian | Immigrants from Eastern Europe |
| Minimum | 2.2% | 5.6% |
| Maximum | 48.9% | 29.1% |
| Range | 46.7% | 23.5% |
| Mean | 17.0% | 16.4% |
| Median | 16.3% | 16.7% |
| Interquartile 25% (IQ1) | 13.5% | 12.9% |
| Interquartile 75% (IQ3) | 18.6% | 19.6% |
| Interquartile Range (IQR) | 5.1% | 6.6% |
| Standard Deviation (Sample) | 6.4% | 5.8% |
| Standard Deviation (Population) | 6.4% | 5.7% |
Similar Demographics by Unemployment Among Ages 16 to 19 years
Demographics Similar to Asians by Unemployment Among Ages 16 to 19 years
In terms of unemployment among ages 16 to 19 years, the demographic groups most similar to Asians are Canadian (16.9%, a difference of 0.040%), Cambodian (16.9%, a difference of 0.080%), Immigrants from South Africa (16.9%, a difference of 0.13%), Greek (16.9%, a difference of 0.19%), and South African (16.9%, a difference of 0.21%).
| Demographics | Rating | Rank | Unemployment Among Ages 16 to 19 years |
| Ugandans | 97.4 /100 | #83 | Exceptional 16.8% |
| French | 97.4 /100 | #84 | Exceptional 16.8% |
| Immigrants | Kuwait | 97.2 /100 | #85 | Exceptional 16.8% |
| Immigrants | Scotland | 97.2 /100 | #86 | Exceptional 16.8% |
| Greeks | 97.0 /100 | #87 | Exceptional 16.9% |
| Immigrants | South Africa | 96.9 /100 | #88 | Exceptional 16.9% |
| Canadians | 96.7 /100 | #89 | Exceptional 16.9% |
| Asians | 96.6 /100 | #90 | Exceptional 16.9% |
| Cambodians | 96.3 /100 | #91 | Exceptional 16.9% |
| South Africans | 95.9 /100 | #92 | Exceptional 16.9% |
| Cubans | 95.8 /100 | #93 | Exceptional 16.9% |
| Bangladeshis | 95.8 /100 | #94 | Exceptional 16.9% |
| Mongolians | 95.6 /100 | #95 | Exceptional 16.9% |
| Ottawa | 95.4 /100 | #96 | Exceptional 16.9% |
| Immigrants | Venezuela | 95.3 /100 | #97 | Exceptional 16.9% |
Demographics Similar to Immigrants from Eastern Europe by Unemployment Among Ages 16 to 19 years
In terms of unemployment among ages 16 to 19 years, the demographic groups most similar to Immigrants from Eastern Europe are Nonimmigrants (17.9%, a difference of 0.18%), Assyrian/Chaldean/Syriac (17.9%, a difference of 0.19%), Immigrants from Portugal (17.8%, a difference of 0.22%), Immigrants from Ethiopia (17.8%, a difference of 0.23%), and Immigrants from Fiji (17.8%, a difference of 0.25%).
| Demographics | Rating | Rank | Unemployment Among Ages 16 to 19 years |
| Alaskan Athabascans | 34.1 /100 | #196 | Fair 17.7% |
| Immigrants | Czechoslovakia | 29.8 /100 | #197 | Fair 17.8% |
| Ethiopians | 29.6 /100 | #198 | Fair 17.8% |
| Immigrants | Ireland | 28.5 /100 | #199 | Fair 17.8% |
| Immigrants | Fiji | 27.7 /100 | #200 | Fair 17.8% |
| Immigrants | Ethiopia | 27.4 /100 | #201 | Fair 17.8% |
| Immigrants | Portugal | 27.2 /100 | #202 | Fair 17.8% |
| Immigrants | Eastern Europe | 23.6 /100 | #203 | Fair 17.8% |
| Immigrants | Nonimmigrants | 20.9 /100 | #204 | Fair 17.9% |
| Assyrians/Chaldeans/Syriacs | 20.8 /100 | #205 | Fair 17.9% |
| Immigrants | Southern Europe | 18.9 /100 | #206 | Poor 17.9% |
| Liberians | 18.6 /100 | #207 | Poor 17.9% |
| Hawaiians | 16.8 /100 | #208 | Poor 17.9% |
| Cherokee | 15.7 /100 | #209 | Poor 17.9% |
| Carpatho Rusyns | 15.6 /100 | #210 | Poor 17.9% |