Asian vs Greek Currently Married
COMPARE
Asian
Greek
Currently Married
Currently Married Comparison
Asians
Greeks
48.4%
CURRENTLY MARRIED
98.5/ 100
METRIC RATING
62nd/ 347
METRIC RANK
48.8%
CURRENTLY MARRIED
99.3/ 100
METRIC RATING
41st/ 347
METRIC RANK
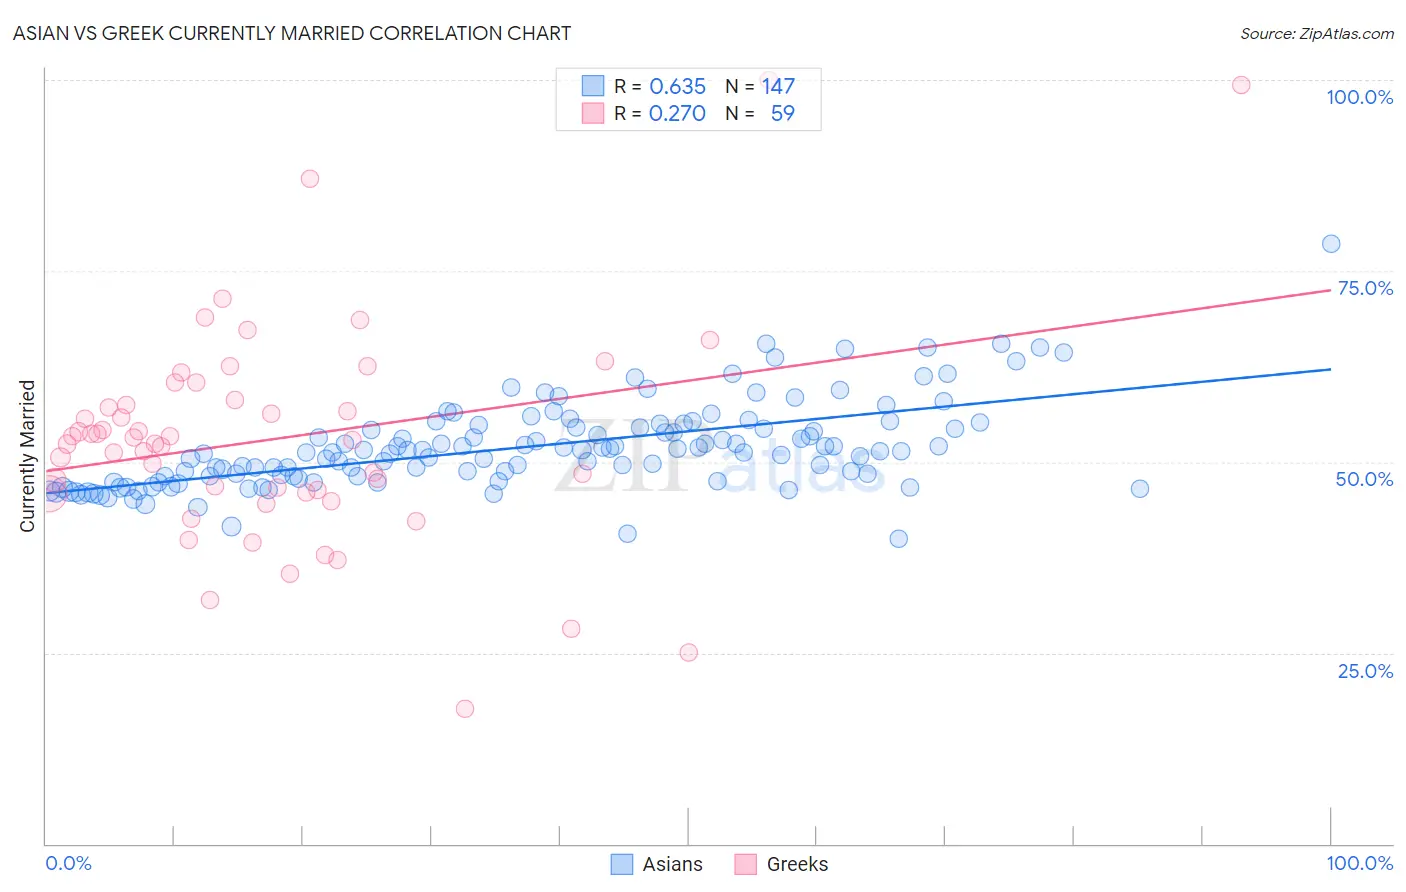
Asian vs Greek Currently Married Correlation Chart
The statistical analysis conducted on geographies consisting of 550,785,629 people shows a significant positive correlation between the proportion of Asians and percentage of population currently married in the United States with a correlation coefficient (R) of 0.635 and weighted average of 48.4%. Similarly, the statistical analysis conducted on geographies consisting of 482,696,171 people shows a weak positive correlation between the proportion of Greeks and percentage of population currently married in the United States with a correlation coefficient (R) of 0.270 and weighted average of 48.8%, a difference of 0.76%.
Currently Married Correlation Summary
| Measurement | Asian | Greek |
| Minimum | 40.0% | 17.7% |
| Maximum | 78.5% | 100.0% |
| Range | 38.5% | 82.3% |
| Mean | 51.9% | 53.0% |
| Median | 51.4% | 52.8% |
| Interquartile 25% (IQ1) | 48.1% | 46.0% |
| Interquartile 75% (IQ3) | 54.5% | 58.1% |
| Interquartile Range (IQR) | 6.4% | 12.1% |
| Standard Deviation (Sample) | 5.7% | 14.5% |
| Standard Deviation (Population) | 5.7% | 14.4% |
Similar Demographics by Currently Married
Demographics Similar to Asians by Currently Married
In terms of currently married, the demographic groups most similar to Asians are Romanian (48.4%, a difference of 0.0%), Immigrants from Romania (48.4%, a difference of 0.010%), Immigrants from Ireland (48.4%, a difference of 0.030%), French (48.4%, a difference of 0.060%), and Immigrants from Netherlands (48.5%, a difference of 0.10%).
| Demographics | Rating | Rank | Currently Married |
| Immigrants | North Macedonia | 98.7 /100 | #55 | Exceptional 48.5% |
| Latvians | 98.7 /100 | #56 | Exceptional 48.5% |
| Immigrants | Netherlands | 98.6 /100 | #57 | Exceptional 48.5% |
| French | 98.6 /100 | #58 | Exceptional 48.4% |
| Immigrants | Ireland | 98.5 /100 | #59 | Exceptional 48.4% |
| Immigrants | Romania | 98.5 /100 | #60 | Exceptional 48.4% |
| Romanians | 98.5 /100 | #61 | Exceptional 48.4% |
| Asians | 98.5 /100 | #62 | Exceptional 48.4% |
| Slavs | 98.3 /100 | #63 | Exceptional 48.4% |
| Immigrants | Czechoslovakia | 98.3 /100 | #64 | Exceptional 48.4% |
| Ukrainians | 98.3 /100 | #65 | Exceptional 48.4% |
| Tongans | 98.2 /100 | #66 | Exceptional 48.3% |
| Slovaks | 98.2 /100 | #67 | Exceptional 48.3% |
| Immigrants | England | 98.2 /100 | #68 | Exceptional 48.3% |
| Canadians | 98.1 /100 | #69 | Exceptional 48.3% |
Demographics Similar to Greeks by Currently Married
In terms of currently married, the demographic groups most similar to Greeks are Immigrants from Canada (48.8%, a difference of 0.020%), British (48.8%, a difference of 0.040%), Finnish (48.8%, a difference of 0.050%), Scotch-Irish (48.7%, a difference of 0.050%), and Czechoslovakian (48.8%, a difference of 0.070%).
| Demographics | Rating | Rank | Currently Married |
| Immigrants | Lithuania | 99.4 /100 | #34 | Exceptional 48.8% |
| Immigrants | Northern Europe | 99.4 /100 | #35 | Exceptional 48.8% |
| Italians | 99.4 /100 | #36 | Exceptional 48.8% |
| Hungarians | 99.4 /100 | #37 | Exceptional 48.8% |
| Czechoslovakians | 99.4 /100 | #38 | Exceptional 48.8% |
| British | 99.4 /100 | #39 | Exceptional 48.8% |
| Immigrants | Canada | 99.4 /100 | #40 | Exceptional 48.8% |
| Greeks | 99.3 /100 | #41 | Exceptional 48.8% |
| Finns | 99.3 /100 | #42 | Exceptional 48.8% |
| Scotch-Irish | 99.3 /100 | #43 | Exceptional 48.7% |
| Immigrants | North America | 99.3 /100 | #44 | Exceptional 48.7% |
| Belgians | 99.3 /100 | #45 | Exceptional 48.7% |
| Immigrants | Iran | 99.2 /100 | #46 | Exceptional 48.7% |
| Northern Europeans | 99.2 /100 | #47 | Exceptional 48.7% |
| Austrians | 99.2 /100 | #48 | Exceptional 48.7% |