Immigrants from Somalia vs Houma Average Family Size
COMPARE
Immigrants from Somalia
Houma
Average Family Size
Average Family Size Comparison
Immigrants from Somalia
Houma
3.20
AVERAGE FAMILY SIZE
10.3/ 100
METRIC RATING
217th/ 347
METRIC RANK
3.18
AVERAGE FAMILY SIZE
3.4/ 100
METRIC RATING
239th/ 347
METRIC RANK
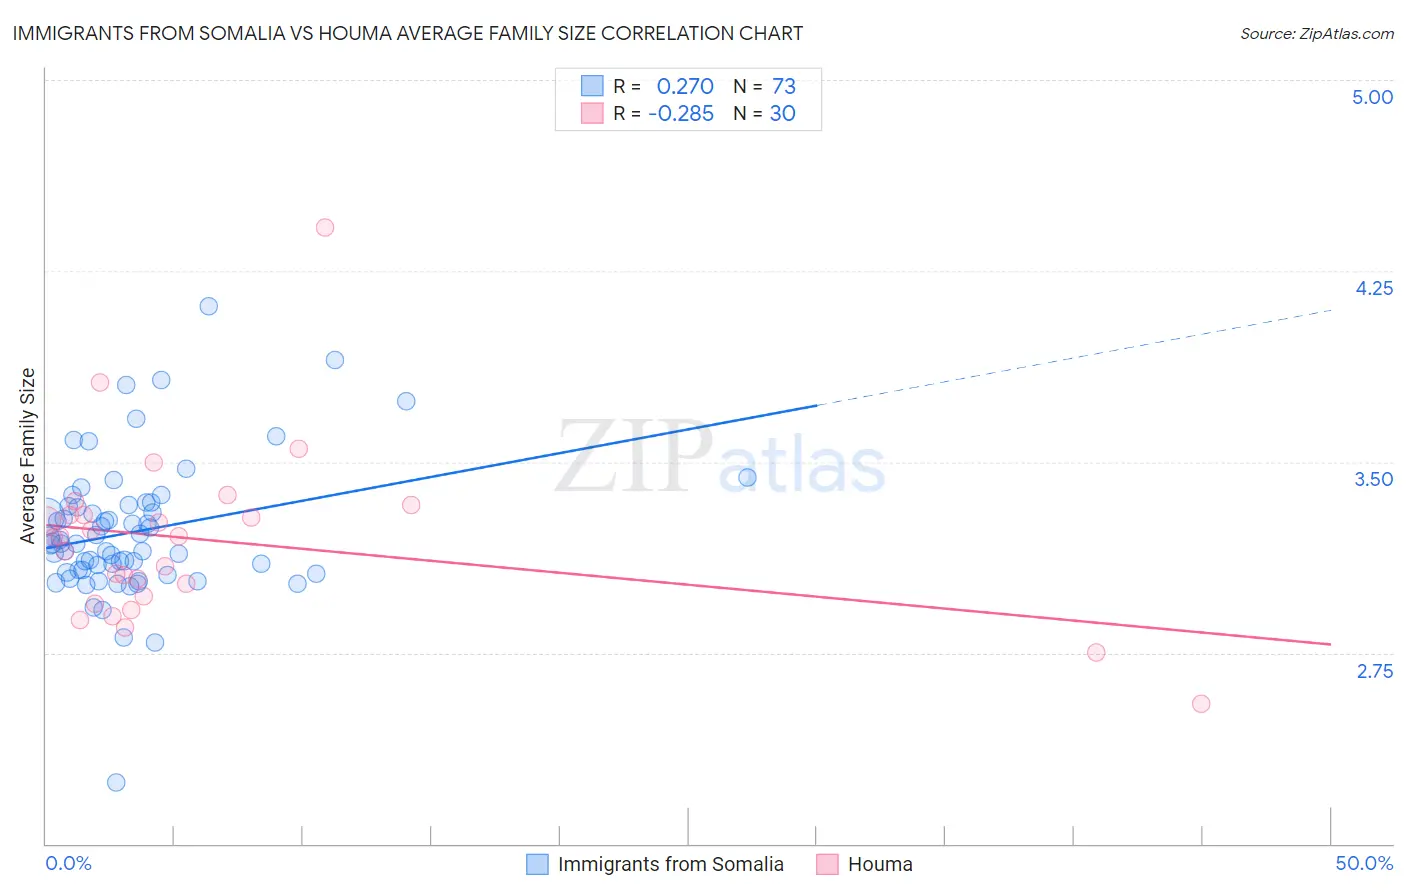
Immigrants from Somalia vs Houma Average Family Size Correlation Chart
The statistical analysis conducted on geographies consisting of 92,093,605 people shows a weak positive correlation between the proportion of Immigrants from Somalia and average family size in the United States with a correlation coefficient (R) of 0.270 and weighted average of 3.20. Similarly, the statistical analysis conducted on geographies consisting of 36,793,313 people shows a weak negative correlation between the proportion of Houma and average family size in the United States with a correlation coefficient (R) of -0.285 and weighted average of 3.18, a difference of 0.55%.
Average Family Size Correlation Summary
| Measurement | Immigrants from Somalia | Houma |
| Minimum | 2.24 | 2.55 |
| Maximum | 4.11 | 4.42 |
| Range | 1.87 | 1.87 |
| Mean | 3.23 | 3.19 |
| Median | 3.18 | 3.20 |
| Interquartile 25% (IQ1) | 3.07 | 2.97 |
| Interquartile 75% (IQ3) | 3.33 | 3.29 |
| Interquartile Range (IQR) | 0.26 | 0.32 |
| Standard Deviation (Sample) | 0.27 | 0.34 |
| Standard Deviation (Population) | 0.27 | 0.34 |
Similar Demographics by Average Family Size
Demographics Similar to Immigrants from Somalia by Average Family Size
In terms of average family size, the demographic groups most similar to Immigrants from Somalia are Bermudan (3.20, a difference of 0.030%), French American Indian (3.20, a difference of 0.030%), Somali (3.20, a difference of 0.040%), Delaware (3.20, a difference of 0.040%), and Pennsylvania German (3.19, a difference of 0.050%).
| Demographics | Rating | Rank | Average Family Size |
| Zimbabweans | 12.6 /100 | #210 | Poor 3.20 |
| Immigrants | Iran | 12.1 /100 | #211 | Poor 3.20 |
| Creek | 12.1 /100 | #212 | Poor 3.20 |
| Mongolians | 11.5 /100 | #213 | Poor 3.20 |
| Somalis | 11.2 /100 | #214 | Poor 3.20 |
| Delaware | 11.1 /100 | #215 | Poor 3.20 |
| Bermudans | 11.0 /100 | #216 | Poor 3.20 |
| Immigrants | Somalia | 10.3 /100 | #217 | Poor 3.20 |
| French American Indians | 9.8 /100 | #218 | Tragic 3.20 |
| Pennsylvania Germans | 9.3 /100 | #219 | Tragic 3.19 |
| Lebanese | 9.1 /100 | #220 | Tragic 3.19 |
| Immigrants | Ukraine | 7.2 /100 | #221 | Tragic 3.19 |
| Immigrants | Kuwait | 7.2 /100 | #222 | Tragic 3.19 |
| Immigrants | Zimbabwe | 7.1 /100 | #223 | Tragic 3.19 |
| Syrians | 6.5 /100 | #224 | Tragic 3.19 |
Demographics Similar to Houma by Average Family Size
In terms of average family size, the demographic groups most similar to Houma are Osage (3.18, a difference of 0.020%), Immigrants from Romania (3.18, a difference of 0.050%), Romanian (3.18, a difference of 0.050%), Immigrants from Japan (3.18, a difference of 0.050%), and Hungarian (3.18, a difference of 0.060%).
| Demographics | Rating | Rank | Average Family Size |
| Cherokee | 4.7 /100 | #232 | Tragic 3.18 |
| Brazilians | 4.5 /100 | #233 | Tragic 3.18 |
| Iranians | 4.5 /100 | #234 | Tragic 3.18 |
| Immigrants | Turkey | 4.2 /100 | #235 | Tragic 3.18 |
| Immigrants | Portugal | 4.2 /100 | #236 | Tragic 3.18 |
| Immigrants | Romania | 3.7 /100 | #237 | Tragic 3.18 |
| Romanians | 3.7 /100 | #238 | Tragic 3.18 |
| Houma | 3.4 /100 | #239 | Tragic 3.18 |
| Osage | 3.2 /100 | #240 | Tragic 3.18 |
| Immigrants | Japan | 3.0 /100 | #241 | Tragic 3.18 |
| Hungarians | 3.0 /100 | #242 | Tragic 3.18 |
| Immigrants | Moldova | 2.9 /100 | #243 | Tragic 3.18 |
| Immigrants | Southern Europe | 2.9 /100 | #244 | Tragic 3.18 |
| Immigrants | Brazil | 2.7 /100 | #245 | Tragic 3.18 |
| Danes | 2.5 /100 | #246 | Tragic 3.17 |