Arapaho vs Finnish Currently Married
COMPARE
Arapaho
Finnish
Currently Married
Currently Married Comparison
Arapaho
Finns
40.5%
CURRENTLY MARRIED
0.0/ 100
METRIC RATING
328th/ 347
METRIC RANK
48.8%
CURRENTLY MARRIED
99.3/ 100
METRIC RATING
42nd/ 347
METRIC RANK
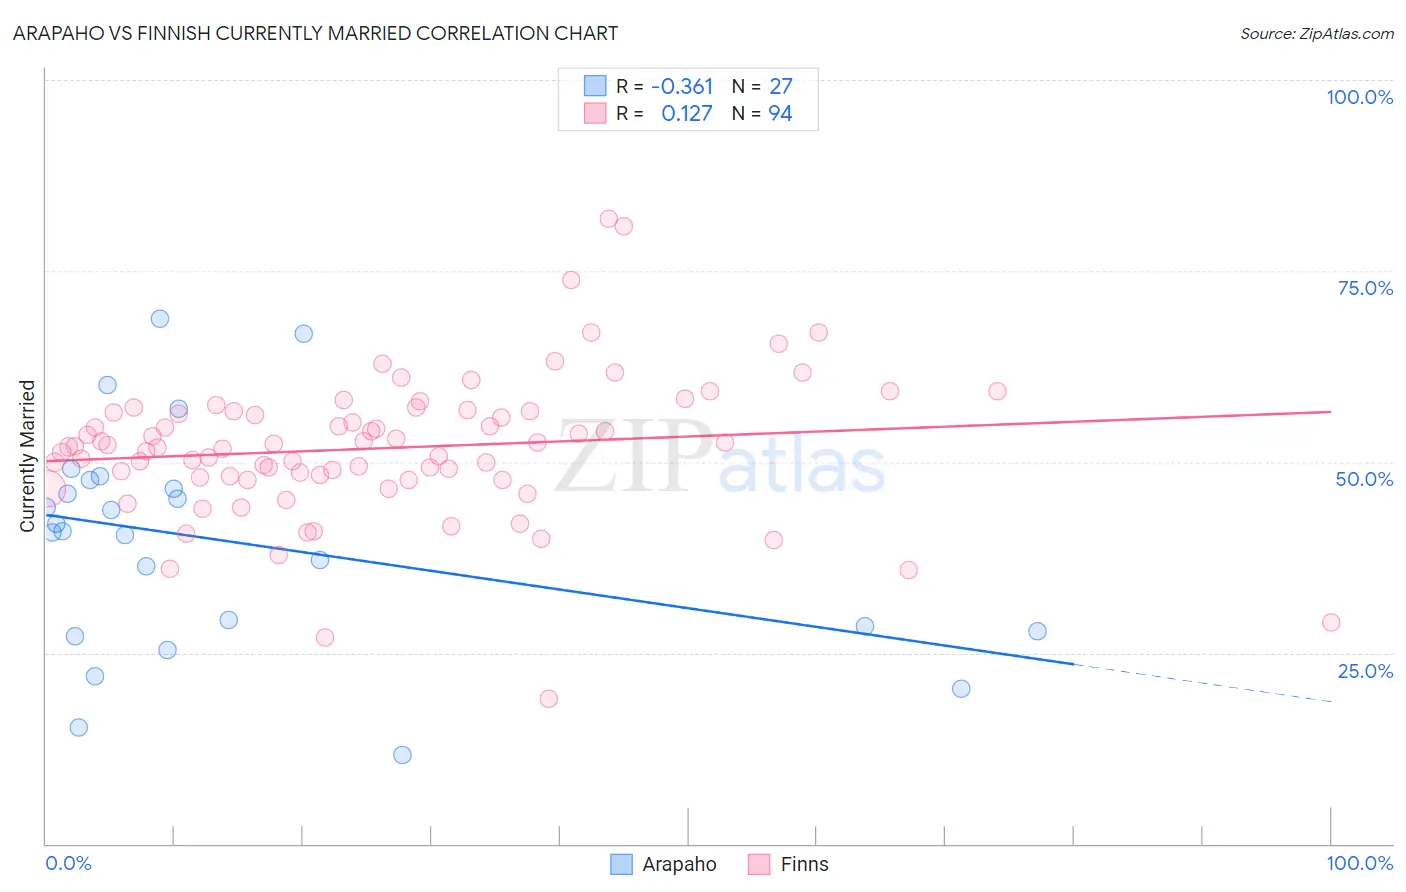
Arapaho vs Finnish Currently Married Correlation Chart
The statistical analysis conducted on geographies consisting of 29,779,567 people shows a mild negative correlation between the proportion of Arapaho and percentage of population currently married in the United States with a correlation coefficient (R) of -0.361 and weighted average of 40.5%. Similarly, the statistical analysis conducted on geographies consisting of 404,666,333 people shows a poor positive correlation between the proportion of Finns and percentage of population currently married in the United States with a correlation coefficient (R) of 0.127 and weighted average of 48.8%, a difference of 20.2%.
Currently Married Correlation Summary
| Measurement | Arapaho | Finnish |
| Minimum | 11.7% | 19.0% |
| Maximum | 68.7% | 81.8% |
| Range | 57.0% | 62.8% |
| Mean | 39.5% | 51.8% |
| Median | 41.0% | 52.0% |
| Interquartile 25% (IQ1) | 27.9% | 47.9% |
| Interquartile 75% (IQ3) | 47.6% | 56.6% |
| Interquartile Range (IQR) | 19.7% | 8.7% |
| Standard Deviation (Sample) | 14.5% | 9.5% |
| Standard Deviation (Population) | 14.3% | 9.4% |
Similar Demographics by Currently Married
Demographics Similar to Arapaho by Currently Married
In terms of currently married, the demographic groups most similar to Arapaho are Senegalese (40.6%, a difference of 0.040%), Barbadian (40.6%, a difference of 0.22%), U.S. Virgin Islander (40.7%, a difference of 0.35%), Immigrants from Senegal (40.7%, a difference of 0.40%), and Immigrants from West Indies (40.7%, a difference of 0.41%).
| Demographics | Rating | Rank | Currently Married |
| Immigrants | Congo | 0.0 /100 | #321 | Tragic 41.1% |
| Immigrants | Haiti | 0.0 /100 | #322 | Tragic 41.0% |
| Immigrants | West Indies | 0.0 /100 | #323 | Tragic 40.7% |
| Immigrants | Senegal | 0.0 /100 | #324 | Tragic 40.7% |
| U.S. Virgin Islanders | 0.0 /100 | #325 | Tragic 40.7% |
| Barbadians | 0.0 /100 | #326 | Tragic 40.6% |
| Senegalese | 0.0 /100 | #327 | Tragic 40.6% |
| Arapaho | 0.0 /100 | #328 | Tragic 40.5% |
| Crow | 0.0 /100 | #329 | Tragic 40.4% |
| Immigrants | Dominica | 0.0 /100 | #330 | Tragic 40.3% |
| Immigrants | Barbados | 0.0 /100 | #331 | Tragic 40.3% |
| Immigrants | St. Vincent and the Grenadines | 0.0 /100 | #332 | Tragic 40.1% |
| Yup'ik | 0.0 /100 | #333 | Tragic 39.9% |
| Puerto Ricans | 0.0 /100 | #334 | Tragic 39.9% |
| Lumbee | 0.0 /100 | #335 | Tragic 39.8% |
Demographics Similar to Finns by Currently Married
In terms of currently married, the demographic groups most similar to Finns are Scotch-Irish (48.7%, a difference of 0.010%), Immigrants from North America (48.7%, a difference of 0.040%), Greek (48.8%, a difference of 0.050%), Immigrants from Canada (48.8%, a difference of 0.060%), and Belgian (48.7%, a difference of 0.060%).
| Demographics | Rating | Rank | Currently Married |
| Immigrants | Northern Europe | 99.4 /100 | #35 | Exceptional 48.8% |
| Italians | 99.4 /100 | #36 | Exceptional 48.8% |
| Hungarians | 99.4 /100 | #37 | Exceptional 48.8% |
| Czechoslovakians | 99.4 /100 | #38 | Exceptional 48.8% |
| British | 99.4 /100 | #39 | Exceptional 48.8% |
| Immigrants | Canada | 99.4 /100 | #40 | Exceptional 48.8% |
| Greeks | 99.3 /100 | #41 | Exceptional 48.8% |
| Finns | 99.3 /100 | #42 | Exceptional 48.8% |
| Scotch-Irish | 99.3 /100 | #43 | Exceptional 48.7% |
| Immigrants | North America | 99.3 /100 | #44 | Exceptional 48.7% |
| Belgians | 99.3 /100 | #45 | Exceptional 48.7% |
| Immigrants | Iran | 99.2 /100 | #46 | Exceptional 48.7% |
| Northern Europeans | 99.2 /100 | #47 | Exceptional 48.7% |
| Austrians | 99.2 /100 | #48 | Exceptional 48.7% |
| Bhutanese | 99.1 /100 | #49 | Exceptional 48.6% |