Arapaho vs Creek Births to Unmarried Women
COMPARE
Arapaho
Creek
Births to Unmarried Women
Births to Unmarried Women Comparison
Arapaho
Creek
47.1%
BIRTHS TO UNMARRIED WOMEN
0.0/ 100
METRIC RATING
338th/ 347
METRIC RANK
37.6%
BIRTHS TO UNMARRIED WOMEN
0.0/ 100
METRIC RATING
287th/ 347
METRIC RANK
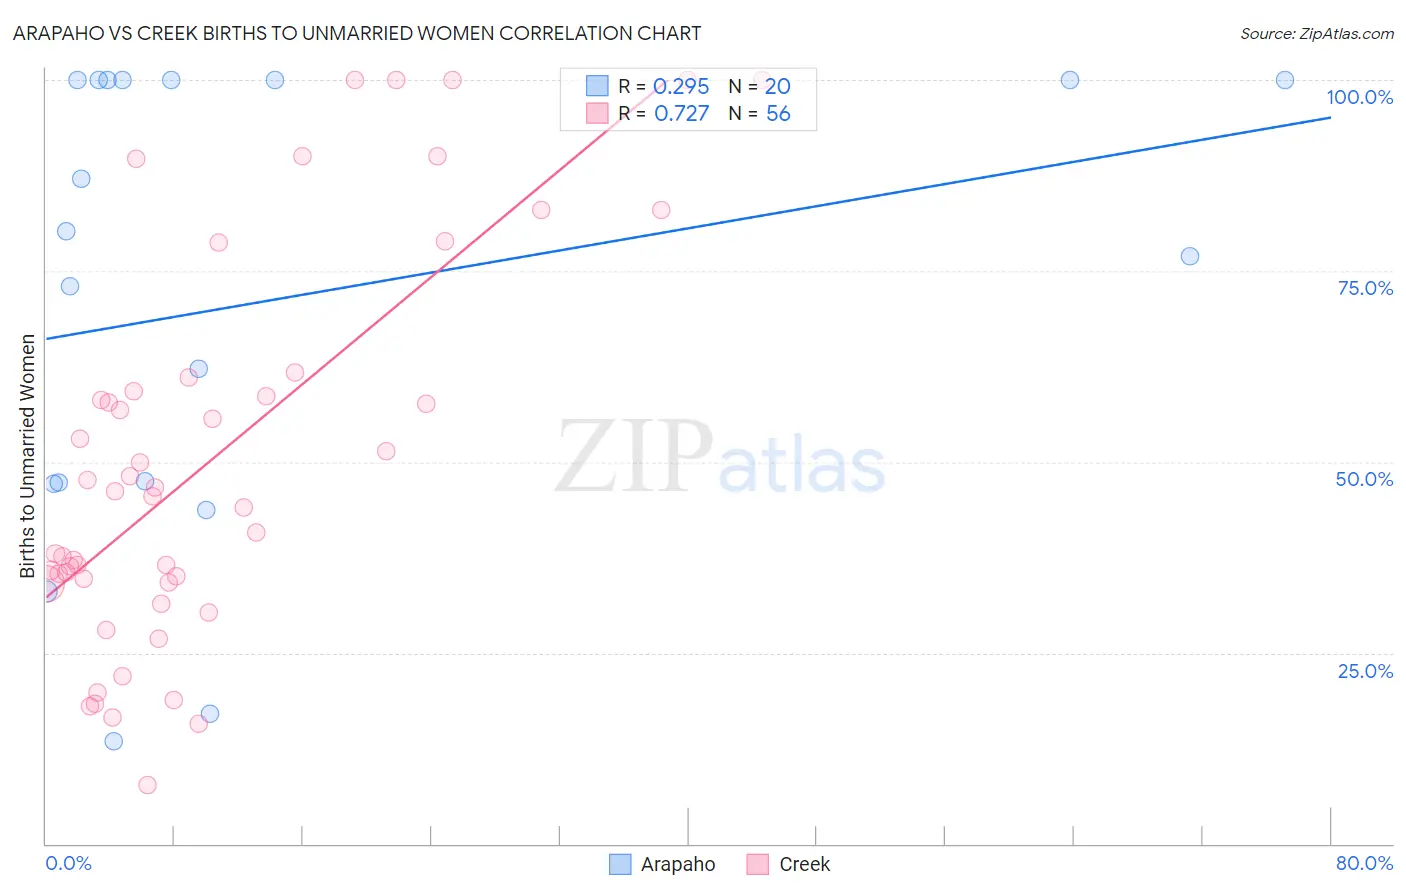
Arapaho vs Creek Births to Unmarried Women Correlation Chart
The statistical analysis conducted on geographies consisting of 29,148,677 people shows a weak positive correlation between the proportion of Arapaho and percentage of births to unmarried women in the United States with a correlation coefficient (R) of 0.295 and weighted average of 47.1%. Similarly, the statistical analysis conducted on geographies consisting of 173,524,470 people shows a strong positive correlation between the proportion of Creek and percentage of births to unmarried women in the United States with a correlation coefficient (R) of 0.727 and weighted average of 37.6%, a difference of 25.4%.
Births to Unmarried Women Correlation Summary
| Measurement | Arapaho | Creek |
| Minimum | 13.4% | 7.7% |
| Maximum | 100.0% | 100.0% |
| Range | 86.6% | 92.3% |
| Mean | 71.4% | 50.2% |
| Median | 78.6% | 45.8% |
| Interquartile 25% (IQ1) | 47.2% | 34.5% |
| Interquartile 75% (IQ3) | 100.0% | 60.2% |
| Interquartile Range (IQR) | 52.8% | 25.7% |
| Standard Deviation (Sample) | 30.2% | 25.3% |
| Standard Deviation (Population) | 29.4% | 25.0% |
Similar Demographics by Births to Unmarried Women
Demographics Similar to Arapaho by Births to Unmarried Women
In terms of births to unmarried women, the demographic groups most similar to Arapaho are Houma (46.6%, a difference of 1.2%), Lumbee (48.2%, a difference of 2.3%), Puerto Rican (45.7%, a difference of 3.2%), Colville (45.3%, a difference of 4.0%), and Tohono O'odham (49.8%, a difference of 5.8%).
| Demographics | Rating | Rank | Births to Unmarried Women |
| Natives/Alaskans | 0.0 /100 | #331 | Tragic 43.0% |
| Kiowa | 0.0 /100 | #332 | Tragic 43.1% |
| Blacks/African Americans | 0.0 /100 | #333 | Tragic 44.3% |
| Yuman | 0.0 /100 | #334 | Tragic 44.4% |
| Colville | 0.0 /100 | #335 | Tragic 45.3% |
| Puerto Ricans | 0.0 /100 | #336 | Tragic 45.7% |
| Houma | 0.0 /100 | #337 | Tragic 46.6% |
| Arapaho | 0.0 /100 | #338 | Tragic 47.1% |
| Lumbee | 0.0 /100 | #339 | Tragic 48.2% |
| Tohono O'odham | 0.0 /100 | #340 | Tragic 49.8% |
| Hopi | 0.0 /100 | #341 | Tragic 50.8% |
| Menominee | 0.0 /100 | #342 | Tragic 51.1% |
| Pima | 0.0 /100 | #343 | Tragic 51.5% |
| Navajo | 0.0 /100 | #344 | Tragic 51.5% |
| Inupiat | 0.0 /100 | #345 | Tragic 52.1% |
Demographics Similar to Creek by Births to Unmarried Women
In terms of births to unmarried women, the demographic groups most similar to Creek are Immigrants from Liberia (37.6%, a difference of 0.17%), Immigrants from Guatemala (37.5%, a difference of 0.23%), Immigrants from Mexico (37.5%, a difference of 0.25%), Immigrants from Central America (37.4%, a difference of 0.35%), and Alaskan Athabascan (37.7%, a difference of 0.40%).
| Demographics | Rating | Rank | Births to Unmarried Women |
| Immigrants | St. Vincent and the Grenadines | 0.1 /100 | #280 | Tragic 37.3% |
| Immigrants | Belize | 0.1 /100 | #281 | Tragic 37.3% |
| Liberians | 0.0 /100 | #282 | Tragic 37.4% |
| Spanish American Indians | 0.0 /100 | #283 | Tragic 37.4% |
| Immigrants | Central America | 0.0 /100 | #284 | Tragic 37.4% |
| Immigrants | Mexico | 0.0 /100 | #285 | Tragic 37.5% |
| Immigrants | Guatemala | 0.0 /100 | #286 | Tragic 37.5% |
| Creek | 0.0 /100 | #287 | Tragic 37.6% |
| Immigrants | Liberia | 0.0 /100 | #288 | Tragic 37.6% |
| Alaskan Athabascans | 0.0 /100 | #289 | Tragic 37.7% |
| Hispanics or Latinos | 0.0 /100 | #290 | Tragic 37.8% |
| Seminole | 0.0 /100 | #291 | Tragic 37.9% |
| Blackfeet | 0.0 /100 | #292 | Tragic 37.9% |
| Immigrants | Nicaragua | 0.0 /100 | #293 | Tragic 38.0% |
| British West Indians | 0.0 /100 | #294 | Tragic 38.0% |