Arapaho vs Sierra Leonean Births to Unmarried Women
COMPARE
Arapaho
Sierra Leonean
Births to Unmarried Women
Births to Unmarried Women Comparison
Arapaho
Sierra Leoneans
47.1%
BIRTHS TO UNMARRIED WOMEN
0.0/ 100
METRIC RATING
338th/ 347
METRIC RANK
34.9%
BIRTHS TO UNMARRIED WOMEN
1.4/ 100
METRIC RATING
239th/ 347
METRIC RANK
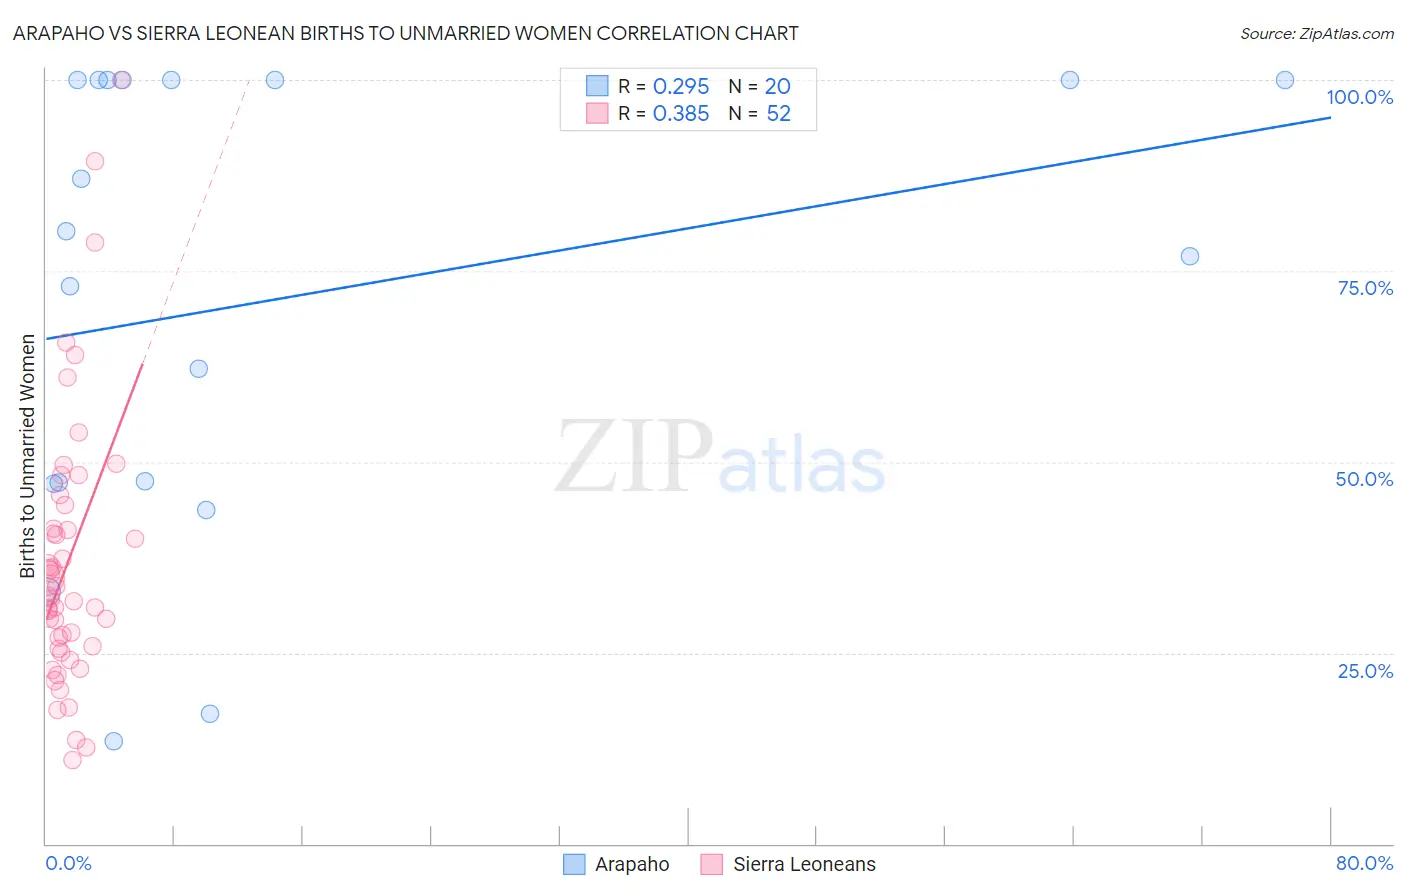
Arapaho vs Sierra Leonean Births to Unmarried Women Correlation Chart
The statistical analysis conducted on geographies consisting of 29,148,677 people shows a weak positive correlation between the proportion of Arapaho and percentage of births to unmarried women in the United States with a correlation coefficient (R) of 0.295 and weighted average of 47.1%. Similarly, the statistical analysis conducted on geographies consisting of 82,118,430 people shows a mild positive correlation between the proportion of Sierra Leoneans and percentage of births to unmarried women in the United States with a correlation coefficient (R) of 0.385 and weighted average of 34.9%, a difference of 35.2%.
Births to Unmarried Women Correlation Summary
| Measurement | Arapaho | Sierra Leonean |
| Minimum | 13.4% | 11.0% |
| Maximum | 100.0% | 100.0% |
| Range | 86.6% | 89.0% |
| Mean | 71.4% | 37.0% |
| Median | 78.6% | 32.2% |
| Interquartile 25% (IQ1) | 47.2% | 25.7% |
| Interquartile 75% (IQ3) | 100.0% | 42.9% |
| Interquartile Range (IQR) | 52.8% | 17.1% |
| Standard Deviation (Sample) | 30.2% | 18.0% |
| Standard Deviation (Population) | 29.4% | 17.9% |
Similar Demographics by Births to Unmarried Women
Demographics Similar to Arapaho by Births to Unmarried Women
In terms of births to unmarried women, the demographic groups most similar to Arapaho are Houma (46.6%, a difference of 1.2%), Lumbee (48.2%, a difference of 2.3%), Puerto Rican (45.7%, a difference of 3.2%), Colville (45.3%, a difference of 4.0%), and Tohono O'odham (49.8%, a difference of 5.8%).
| Demographics | Rating | Rank | Births to Unmarried Women |
| Natives/Alaskans | 0.0 /100 | #331 | Tragic 43.0% |
| Kiowa | 0.0 /100 | #332 | Tragic 43.1% |
| Blacks/African Americans | 0.0 /100 | #333 | Tragic 44.3% |
| Yuman | 0.0 /100 | #334 | Tragic 44.4% |
| Colville | 0.0 /100 | #335 | Tragic 45.3% |
| Puerto Ricans | 0.0 /100 | #336 | Tragic 45.7% |
| Houma | 0.0 /100 | #337 | Tragic 46.6% |
| Arapaho | 0.0 /100 | #338 | Tragic 47.1% |
| Lumbee | 0.0 /100 | #339 | Tragic 48.2% |
| Tohono O'odham | 0.0 /100 | #340 | Tragic 49.8% |
| Hopi | 0.0 /100 | #341 | Tragic 50.8% |
| Menominee | 0.0 /100 | #342 | Tragic 51.1% |
| Pima | 0.0 /100 | #343 | Tragic 51.5% |
| Navajo | 0.0 /100 | #344 | Tragic 51.5% |
| Inupiat | 0.0 /100 | #345 | Tragic 52.1% |
Demographics Similar to Sierra Leoneans by Births to Unmarried Women
In terms of births to unmarried women, the demographic groups most similar to Sierra Leoneans are Immigrants from Cambodia (34.8%, a difference of 0.22%), Immigrants from Middle Africa (34.9%, a difference of 0.25%), Marshallese (34.8%, a difference of 0.28%), Immigrants from Guyana (35.0%, a difference of 0.28%), and Immigrants from Cameroon (34.7%, a difference of 0.36%).
| Demographics | Rating | Rank | Births to Unmarried Women |
| French Canadians | 2.5 /100 | #232 | Tragic 34.4% |
| Bangladeshis | 2.5 /100 | #233 | Tragic 34.4% |
| Immigrants | Zaire | 2.3 /100 | #234 | Tragic 34.5% |
| Immigrants | Ghana | 2.2 /100 | #235 | Tragic 34.5% |
| Immigrants | Cameroon | 1.6 /100 | #236 | Tragic 34.7% |
| Marshallese | 1.6 /100 | #237 | Tragic 34.8% |
| Immigrants | Cambodia | 1.6 /100 | #238 | Tragic 34.8% |
| Sierra Leoneans | 1.4 /100 | #239 | Tragic 34.9% |
| Immigrants | Middle Africa | 1.2 /100 | #240 | Tragic 34.9% |
| Immigrants | Guyana | 1.2 /100 | #241 | Tragic 35.0% |
| Indonesians | 1.2 /100 | #242 | Tragic 35.0% |
| Japanese | 0.9 /100 | #243 | Tragic 35.2% |
| Guyanese | 0.9 /100 | #244 | Tragic 35.2% |
| Shoshone | 0.8 /100 | #245 | Tragic 35.3% |
| Nigerians | 0.7 /100 | #246 | Tragic 35.3% |