Arapaho vs Creek 7th Grade
COMPARE
Arapaho
Creek
7th Grade
7th Grade Comparison
Arapaho
Creek
96.8%
7TH GRADE
99.5/ 100
METRIC RATING
73rd/ 347
METRIC RANK
96.9%
7TH GRADE
99.8/ 100
METRIC RATING
61st/ 347
METRIC RANK
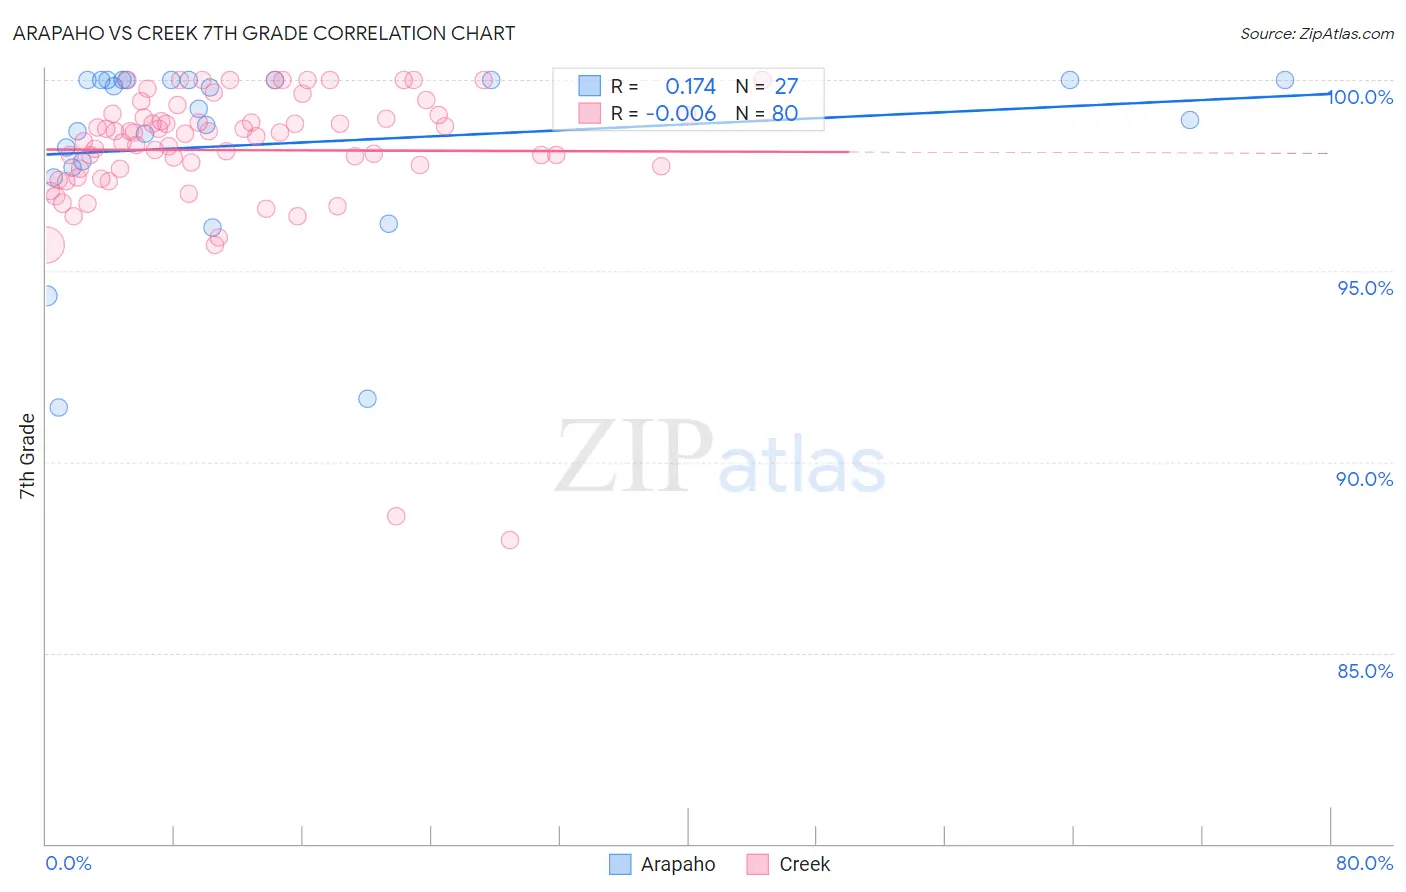
Arapaho vs Creek 7th Grade Correlation Chart
The statistical analysis conducted on geographies consisting of 29,780,325 people shows a poor positive correlation between the proportion of Arapaho and percentage of population with at least 7th grade education in the United States with a correlation coefficient (R) of 0.174 and weighted average of 96.8%. Similarly, the statistical analysis conducted on geographies consisting of 178,480,629 people shows no correlation between the proportion of Creek and percentage of population with at least 7th grade education in the United States with a correlation coefficient (R) of -0.006 and weighted average of 96.9%, a difference of 0.13%.
7th Grade Correlation Summary
| Measurement | Arapaho | Creek |
| Minimum | 91.4% | 88.0% |
| Maximum | 100.0% | 100.0% |
| Range | 8.6% | 12.0% |
| Mean | 98.3% | 98.2% |
| Median | 99.3% | 98.6% |
| Interquartile 25% (IQ1) | 97.7% | 97.7% |
| Interquartile 75% (IQ3) | 100.0% | 99.1% |
| Interquartile Range (IQR) | 2.3% | 1.4% |
| Standard Deviation (Sample) | 2.4% | 1.9% |
| Standard Deviation (Population) | 2.4% | 1.9% |
Demographics Similar to Arapaho and Creek by 7th Grade
In terms of 7th grade, the demographic groups most similar to Arapaho are Cajun (96.8%, a difference of 0.010%), Immigrants from England (96.8%, a difference of 0.010%), Zimbabwean (96.8%, a difference of 0.010%), Immigrants from Lithuania (96.8%, a difference of 0.020%), and Iranian (96.8%, a difference of 0.030%). Similarly, the demographic groups most similar to Creek are Immigrants from Canada (96.9%, a difference of 0.0%), White/Caucasian (97.0%, a difference of 0.010%), Macedonian (97.0%, a difference of 0.010%), Immigrants from North America (96.9%, a difference of 0.010%), and Immigrants from Northern Europe (96.9%, a difference of 0.020%).
| Demographics | Rating | Rank | 7th Grade |
| Americans | 99.8 /100 | #57 | Exceptional 97.0% |
| Whites/Caucasians | 99.8 /100 | #58 | Exceptional 97.0% |
| Macedonians | 99.8 /100 | #59 | Exceptional 97.0% |
| Immigrants | Canada | 99.8 /100 | #60 | Exceptional 96.9% |
| Creek | 99.8 /100 | #61 | Exceptional 96.9% |
| Immigrants | North America | 99.8 /100 | #62 | Exceptional 96.9% |
| Immigrants | Northern Europe | 99.7 /100 | #63 | Exceptional 96.9% |
| Immigrants | Austria | 99.7 /100 | #64 | Exceptional 96.9% |
| Canadians | 99.7 /100 | #65 | Exceptional 96.9% |
| Ukrainians | 99.7 /100 | #66 | Exceptional 96.9% |
| Native Hawaiians | 99.7 /100 | #67 | Exceptional 96.9% |
| Immigrants | India | 99.6 /100 | #68 | Exceptional 96.9% |
| Iranians | 99.6 /100 | #69 | Exceptional 96.8% |
| New Zealanders | 99.6 /100 | #70 | Exceptional 96.8% |
| Immigrants | Lithuania | 99.6 /100 | #71 | Exceptional 96.8% |
| Cajuns | 99.5 /100 | #72 | Exceptional 96.8% |
| Arapaho | 99.5 /100 | #73 | Exceptional 96.8% |
| Immigrants | England | 99.5 /100 | #74 | Exceptional 96.8% |
| Zimbabweans | 99.5 /100 | #75 | Exceptional 96.8% |
| Immigrants | Ireland | 99.4 /100 | #76 | Exceptional 96.8% |
| Cherokee | 99.4 /100 | #77 | Exceptional 96.8% |