Israeli vs Luxembourger Average Family Size
COMPARE
Israeli
Luxembourger
Average Family Size
Average Family Size Comparison
Israelis
Luxembourgers
3.23
AVERAGE FAMILY SIZE
48.7/ 100
METRIC RATING
176th/ 347
METRIC RANK
3.10
AVERAGE FAMILY SIZE
0.0/ 100
METRIC RATING
335th/ 347
METRIC RANK
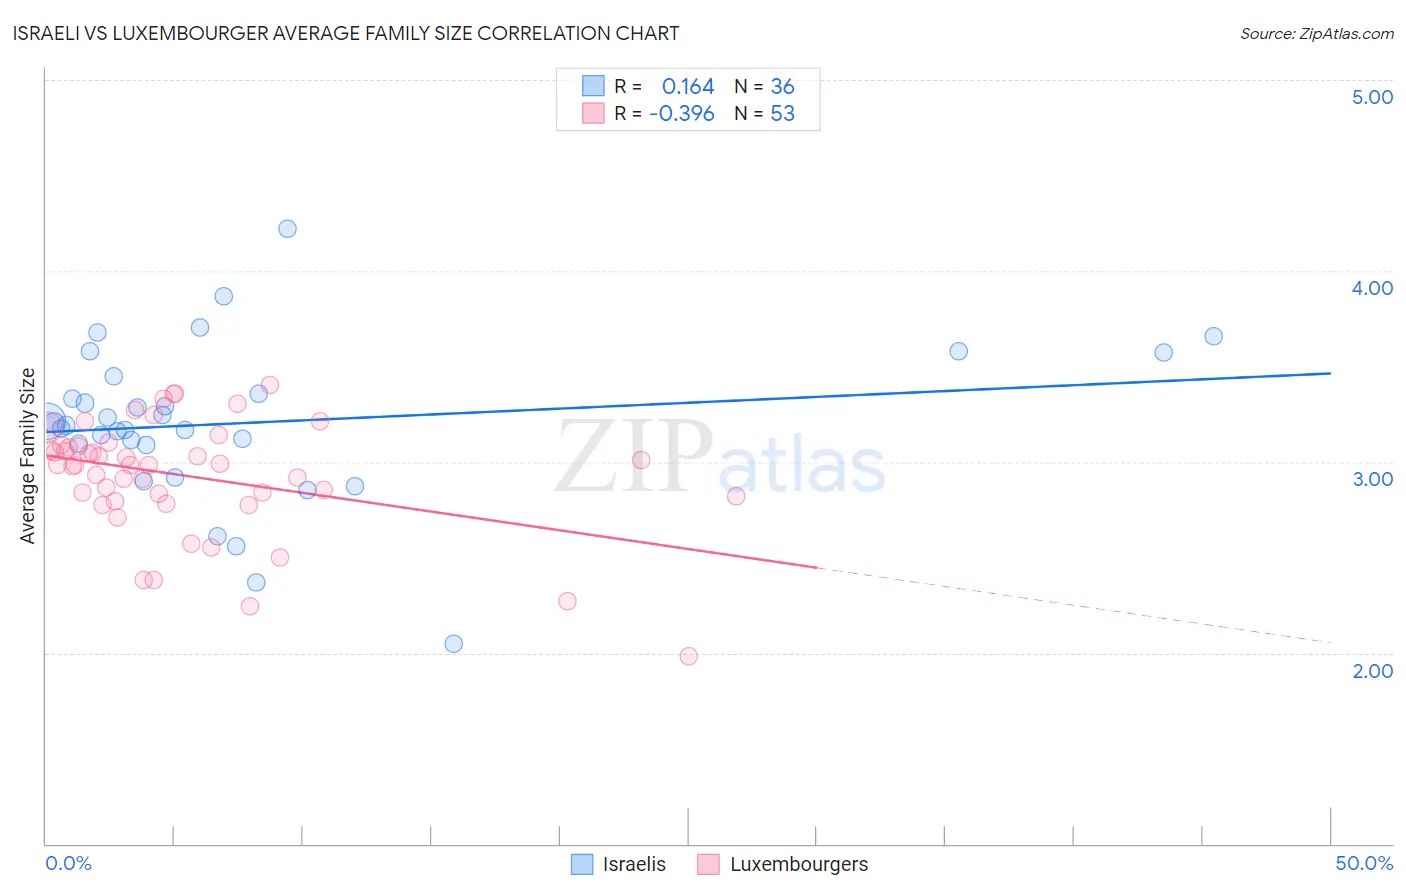
Israeli vs Luxembourger Average Family Size Correlation Chart
The statistical analysis conducted on geographies consisting of 211,000,006 people shows a poor positive correlation between the proportion of Israelis and average family size in the United States with a correlation coefficient (R) of 0.164 and weighted average of 3.23. Similarly, the statistical analysis conducted on geographies consisting of 144,654,567 people shows a mild negative correlation between the proportion of Luxembourgers and average family size in the United States with a correlation coefficient (R) of -0.396 and weighted average of 3.10, a difference of 4.0%.
Average Family Size Correlation Summary
| Measurement | Israeli | Luxembourger |
| Minimum | 2.05 | 1.98 |
| Maximum | 4.22 | 3.40 |
| Range | 2.17 | 1.42 |
| Mean | 3.20 | 2.92 |
| Median | 3.20 | 2.98 |
| Interquartile 25% (IQ1) | 3.09 | 2.81 |
| Interquartile 75% (IQ3) | 3.40 | 3.09 |
| Interquartile Range (IQR) | 0.31 | 0.28 |
| Standard Deviation (Sample) | 0.41 | 0.30 |
| Standard Deviation (Population) | 0.41 | 0.30 |
Similar Demographics by Average Family Size
Demographics Similar to Israelis by Average Family Size
In terms of average family size, the demographic groups most similar to Israelis are Immigrants from South Central Asia (3.23, a difference of 0.020%), Immigrants from China (3.23, a difference of 0.020%), Argentinean (3.23, a difference of 0.020%), Spaniard (3.23, a difference of 0.030%), and Immigrants from Korea (3.23, a difference of 0.030%).
| Demographics | Rating | Rank | Average Family Size |
| Aleuts | 54.1 /100 | #169 | Average 3.23 |
| Arabs | 53.8 /100 | #170 | Average 3.23 |
| Chileans | 53.2 /100 | #171 | Average 3.23 |
| Immigrants | Congo | 52.7 /100 | #172 | Average 3.23 |
| Immigrants | Uruguay | 52.0 /100 | #173 | Average 3.23 |
| Immigrants | South Central Asia | 50.0 /100 | #174 | Average 3.23 |
| Immigrants | China | 49.9 /100 | #175 | Average 3.23 |
| Israelis | 48.7 /100 | #176 | Average 3.23 |
| Argentineans | 47.4 /100 | #177 | Average 3.23 |
| Spaniards | 47.2 /100 | #178 | Average 3.23 |
| Immigrants | Korea | 46.9 /100 | #179 | Average 3.23 |
| Palestinians | 46.6 /100 | #180 | Average 3.23 |
| Spanish | 44.8 /100 | #181 | Average 3.23 |
| Moroccans | 44.2 /100 | #182 | Average 3.22 |
| Immigrants | Northern Africa | 41.7 /100 | #183 | Average 3.22 |
Demographics Similar to Luxembourgers by Average Family Size
In terms of average family size, the demographic groups most similar to Luxembourgers are Estonian (3.10, a difference of 0.030%), Lithuanian (3.10, a difference of 0.030%), Irish (3.10, a difference of 0.060%), Scotch-Irish (3.11, a difference of 0.080%), and Scottish (3.11, a difference of 0.080%).
| Demographics | Rating | Rank | Average Family Size |
| Czechs | 0.0 /100 | #328 | Tragic 3.11 |
| Belgians | 0.0 /100 | #329 | Tragic 3.11 |
| Latvians | 0.0 /100 | #330 | Tragic 3.11 |
| Scotch-Irish | 0.0 /100 | #331 | Tragic 3.11 |
| Scottish | 0.0 /100 | #332 | Tragic 3.11 |
| Estonians | 0.0 /100 | #333 | Tragic 3.10 |
| Lithuanians | 0.0 /100 | #334 | Tragic 3.10 |
| Luxembourgers | 0.0 /100 | #335 | Tragic 3.10 |
| Irish | 0.0 /100 | #336 | Tragic 3.10 |
| Swedes | 0.0 /100 | #337 | Tragic 3.10 |
| French | 0.0 /100 | #338 | Tragic 3.10 |
| Croatians | 0.0 /100 | #339 | Tragic 3.10 |
| Finns | 0.0 /100 | #340 | Tragic 3.09 |
| Poles | 0.0 /100 | #341 | Tragic 3.09 |
| Germans | 0.0 /100 | #342 | Tragic 3.09 |