Arab vs Luxembourger Unemployment Among Ages 45 to 54 years
COMPARE
Arab
Luxembourger
Unemployment Among Ages 45 to 54 years
Unemployment Among Ages 45 to 54 years Comparison
Arabs
Luxembourgers
4.6%
UNEMPLOYMENT AMONG AGES 45 TO 54 YEARS
13.7/ 100
METRIC RATING
207th/ 347
METRIC RANK
4.2%
UNEMPLOYMENT AMONG AGES 45 TO 54 YEARS
99.6/ 100
METRIC RATING
46th/ 347
METRIC RANK
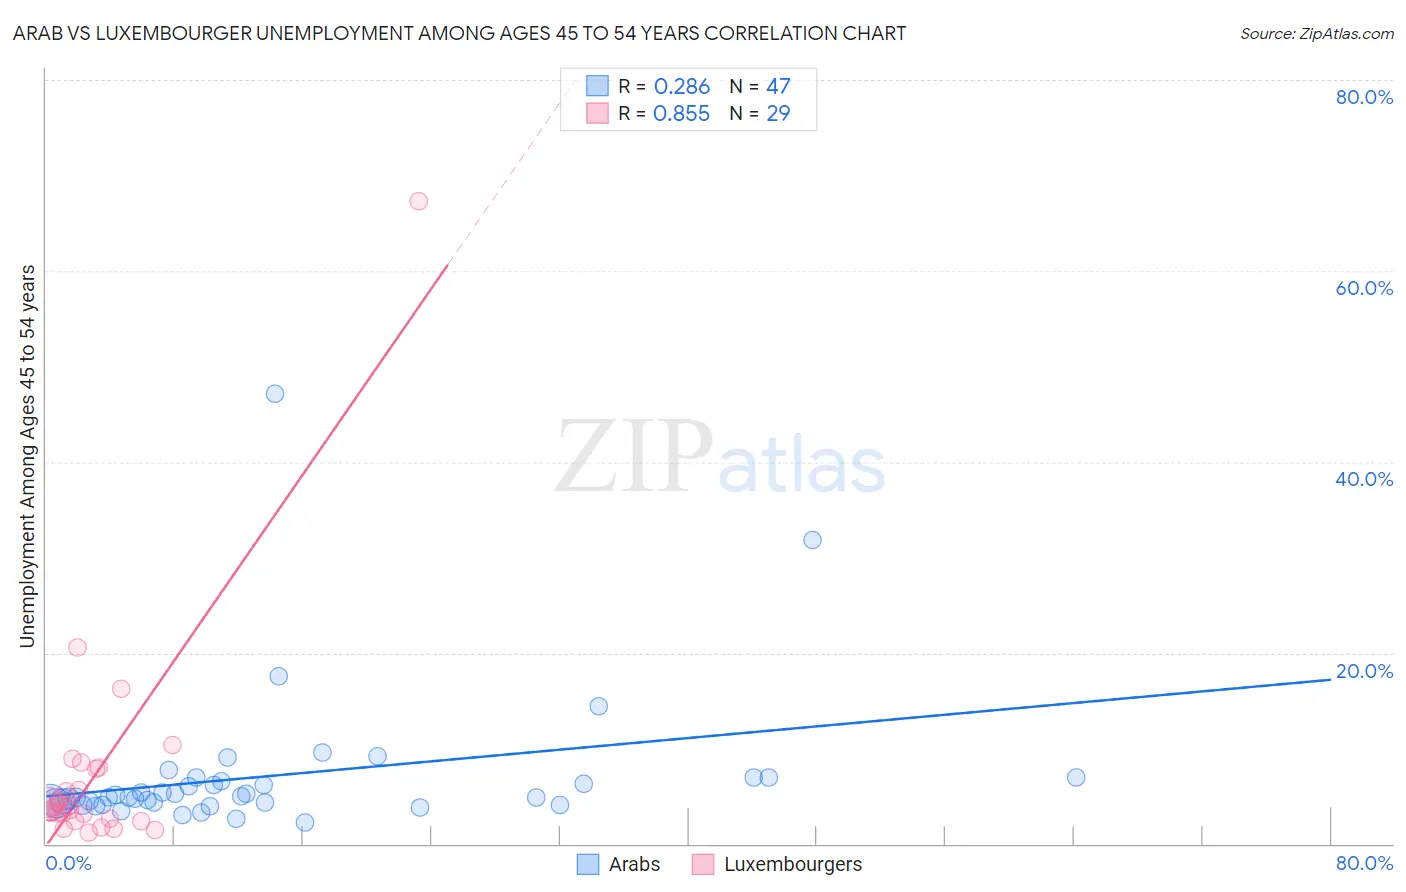
Arab vs Luxembourger Unemployment Among Ages 45 to 54 years Correlation Chart
The statistical analysis conducted on geographies consisting of 468,693,746 people shows a weak positive correlation between the proportion of Arabs and unemployment rate among population between the ages 45 and 54 in the United States with a correlation coefficient (R) of 0.286 and weighted average of 4.6%. Similarly, the statistical analysis conducted on geographies consisting of 141,471,096 people shows a very strong positive correlation between the proportion of Luxembourgers and unemployment rate among population between the ages 45 and 54 in the United States with a correlation coefficient (R) of 0.855 and weighted average of 4.2%, a difference of 9.3%.
Unemployment Among Ages 45 to 54 years Correlation Summary
| Measurement | Arab | Luxembourger |
| Minimum | 2.2% | 1.2% |
| Maximum | 47.2% | 67.3% |
| Range | 45.0% | 66.1% |
| Mean | 7.1% | 7.4% |
| Median | 4.9% | 3.8% |
| Interquartile 25% (IQ1) | 4.3% | 2.5% |
| Interquartile 75% (IQ3) | 6.9% | 8.0% |
| Interquartile Range (IQR) | 2.6% | 5.5% |
| Standard Deviation (Sample) | 7.6% | 12.3% |
| Standard Deviation (Population) | 7.5% | 12.1% |
Similar Demographics by Unemployment Among Ages 45 to 54 years
Demographics Similar to Arabs by Unemployment Among Ages 45 to 54 years
In terms of unemployment among ages 45 to 54 years, the demographic groups most similar to Arabs are Immigrants from Africa (4.6%, a difference of 0.020%), Immigrants from Switzerland (4.6%, a difference of 0.030%), Immigrants from Nigeria (4.6%, a difference of 0.050%), Immigrants from South America (4.6%, a difference of 0.15%), and Creek (4.6%, a difference of 0.19%).
| Demographics | Rating | Rank | Unemployment Among Ages 45 to 54 years |
| Immigrants | Denmark | 19.8 /100 | #200 | Poor 4.6% |
| Immigrants | Costa Rica | 19.7 /100 | #201 | Poor 4.6% |
| Immigrants | Peru | 19.1 /100 | #202 | Poor 4.6% |
| Liberians | 18.7 /100 | #203 | Poor 4.6% |
| Immigrants | Morocco | 16.8 /100 | #204 | Poor 4.6% |
| Immigrants | Greece | 16.2 /100 | #205 | Poor 4.6% |
| Immigrants | Switzerland | 14.0 /100 | #206 | Poor 4.6% |
| Arabs | 13.7 /100 | #207 | Poor 4.6% |
| Immigrants | Africa | 13.6 /100 | #208 | Poor 4.6% |
| Immigrants | Nigeria | 13.3 /100 | #209 | Poor 4.6% |
| Immigrants | South America | 12.2 /100 | #210 | Poor 4.6% |
| Creek | 11.9 /100 | #211 | Poor 4.6% |
| Immigrants | Iran | 11.5 /100 | #212 | Poor 4.6% |
| Panamanians | 10.7 /100 | #213 | Poor 4.6% |
| Cherokee | 10.6 /100 | #214 | Poor 4.6% |
Demographics Similar to Luxembourgers by Unemployment Among Ages 45 to 54 years
In terms of unemployment among ages 45 to 54 years, the demographic groups most similar to Luxembourgers are Filipino (4.2%, a difference of 0.010%), Finnish (4.2%, a difference of 0.080%), Immigrants from Bulgaria (4.2%, a difference of 0.090%), Immigrants from Zimbabwe (4.2%, a difference of 0.12%), and Basque (4.2%, a difference of 0.13%).
| Demographics | Rating | Rank | Unemployment Among Ages 45 to 54 years |
| Jordanians | 99.8 /100 | #39 | Exceptional 4.2% |
| Northern Europeans | 99.8 /100 | #40 | Exceptional 4.2% |
| Czechoslovakians | 99.8 /100 | #41 | Exceptional 4.2% |
| Immigrants | Scotland | 99.8 /100 | #42 | Exceptional 4.2% |
| Zimbabweans | 99.8 /100 | #43 | Exceptional 4.2% |
| Immigrants | Singapore | 99.7 /100 | #44 | Exceptional 4.2% |
| Immigrants | Bulgaria | 99.7 /100 | #45 | Exceptional 4.2% |
| Luxembourgers | 99.6 /100 | #46 | Exceptional 4.2% |
| Filipinos | 99.6 /100 | #47 | Exceptional 4.2% |
| Finns | 99.6 /100 | #48 | Exceptional 4.2% |
| Immigrants | Zimbabwe | 99.6 /100 | #49 | Exceptional 4.2% |
| Basques | 99.6 /100 | #50 | Exceptional 4.2% |
| Burmese | 99.6 /100 | #51 | Exceptional 4.2% |
| Poles | 99.5 /100 | #52 | Exceptional 4.2% |
| Irish | 99.5 /100 | #53 | Exceptional 4.2% |