Arab vs Immigrants from South America Married-couple Households
COMPARE
Arab
Immigrants from South America
Married-couple Households
Married-couple Households Comparison
Arabs
Immigrants from South America
46.9%
MARRIED-COUPLE HOUSEHOLDS
76.0/ 100
METRIC RATING
155th/ 347
METRIC RANK
45.9%
MARRIED-COUPLE HOUSEHOLDS
22.2/ 100
METRIC RATING
196th/ 347
METRIC RANK
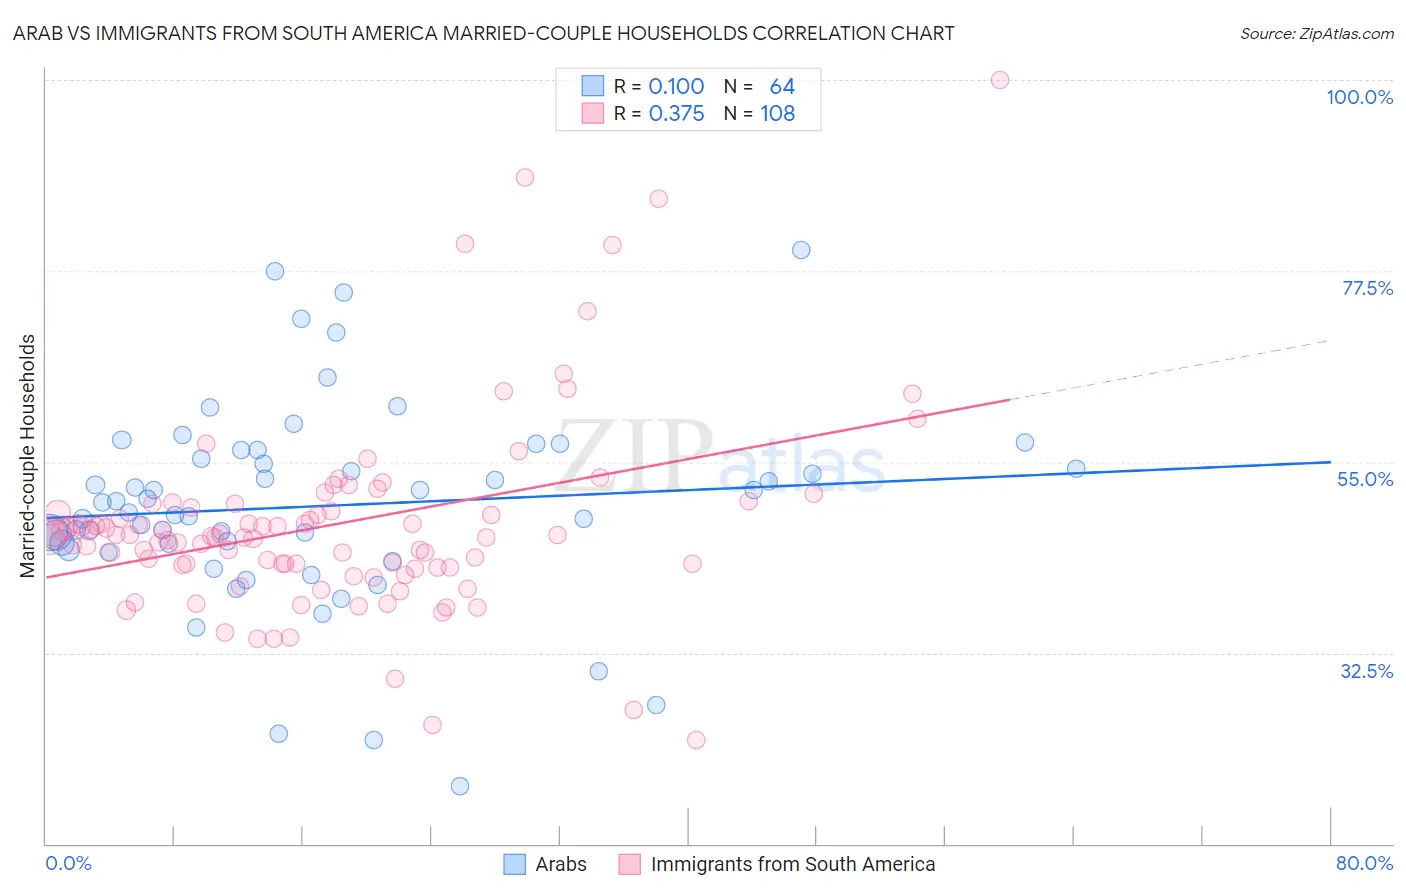
Arab vs Immigrants from South America Married-couple Households Correlation Chart
The statistical analysis conducted on geographies consisting of 486,357,143 people shows a slight positive correlation between the proportion of Arabs and percentage of married-couple family households in the United States with a correlation coefficient (R) of 0.100 and weighted average of 46.9%. Similarly, the statistical analysis conducted on geographies consisting of 486,013,684 people shows a mild positive correlation between the proportion of Immigrants from South America and percentage of married-couple family households in the United States with a correlation coefficient (R) of 0.375 and weighted average of 45.9%, a difference of 2.3%.
Married-couple Households Correlation Summary
| Measurement | Arab | Immigrants from South America |
| Minimum | 16.8% | 22.2% |
| Maximum | 80.0% | 100.0% |
| Range | 63.2% | 77.8% |
| Mean | 49.8% | 47.6% |
| Median | 49.6% | 46.2% |
| Interquartile 25% (IQ1) | 45.0% | 42.7% |
| Interquartile 75% (IQ3) | 55.9% | 49.4% |
| Interquartile Range (IQR) | 11.0% | 6.7% |
| Standard Deviation (Sample) | 11.9% | 11.7% |
| Standard Deviation (Population) | 11.8% | 11.6% |
Similar Demographics by Married-couple Households
Demographics Similar to Arabs by Married-couple Households
In terms of married-couple households, the demographic groups most similar to Arabs are Hmong (47.0%, a difference of 0.010%), Immigrants from Western Asia (46.9%, a difference of 0.010%), Serbian (47.0%, a difference of 0.020%), Armenian (46.9%, a difference of 0.030%), and Immigrants from Bulgaria (47.0%, a difference of 0.040%).
| Demographics | Rating | Rank | Married-couple Households |
| Icelanders | 79.5 /100 | #148 | Good 47.0% |
| Paraguayans | 78.7 /100 | #149 | Good 47.0% |
| Immigrants | Russia | 77.6 /100 | #150 | Good 47.0% |
| Immigrants | Bulgaria | 76.8 /100 | #151 | Good 47.0% |
| Serbians | 76.3 /100 | #152 | Good 47.0% |
| Hmong | 76.2 /100 | #153 | Good 47.0% |
| Immigrants | Western Asia | 76.1 /100 | #154 | Good 46.9% |
| Arabs | 76.0 /100 | #155 | Good 46.9% |
| Armenians | 75.4 /100 | #156 | Good 46.9% |
| Immigrants | Oceania | 74.8 /100 | #157 | Good 46.9% |
| Immigrants | Nonimmigrants | 73.3 /100 | #158 | Good 46.9% |
| Osage | 73.2 /100 | #159 | Good 46.9% |
| Iraqis | 71.7 /100 | #160 | Good 46.9% |
| Delaware | 71.2 /100 | #161 | Good 46.8% |
| Colombians | 71.0 /100 | #162 | Good 46.8% |
Demographics Similar to Immigrants from South America by Married-couple Households
In terms of married-couple households, the demographic groups most similar to Immigrants from South America are Chickasaw (45.9%, a difference of 0.030%), Cambodian (45.9%, a difference of 0.050%), Mexican American Indian (45.9%, a difference of 0.060%), Taiwanese (45.9%, a difference of 0.070%), and Immigrants from Northern Africa (46.0%, a difference of 0.13%).
| Demographics | Rating | Rank | Married-couple Households |
| Immigrants | Latvia | 26.9 /100 | #189 | Fair 46.0% |
| Immigrants | Kuwait | 25.6 /100 | #190 | Fair 46.0% |
| Choctaw | 24.9 /100 | #191 | Fair 46.0% |
| Immigrants | Northern Africa | 24.6 /100 | #192 | Fair 46.0% |
| Taiwanese | 23.4 /100 | #193 | Fair 45.9% |
| Mexican American Indians | 23.3 /100 | #194 | Fair 45.9% |
| Chickasaw | 22.7 /100 | #195 | Fair 45.9% |
| Immigrants | South America | 22.2 /100 | #196 | Fair 45.9% |
| Cambodians | 21.3 /100 | #197 | Fair 45.9% |
| Ottawa | 19.4 /100 | #198 | Poor 45.8% |
| Carpatho Rusyns | 15.7 /100 | #199 | Poor 45.7% |
| Potawatomi | 15.6 /100 | #200 | Poor 45.7% |
| Immigrants | Serbia | 15.2 /100 | #201 | Poor 45.7% |
| Immigrants | Central America | 14.2 /100 | #202 | Poor 45.7% |
| Alaska Natives | 13.0 /100 | #203 | Poor 45.6% |