Apache vs White/Caucasian Single Father Households
COMPARE
Apache
White/Caucasian
Single Father Households
Single Father Households Comparison
Apache
Whites/Caucasians
2.8%
SINGLE FATHER HOUSEHOLDS
0.0/ 100
METRIC RATING
308th/ 347
METRIC RANK
2.4%
SINGLE FATHER HOUSEHOLDS
22.6/ 100
METRIC RATING
207th/ 347
METRIC RANK
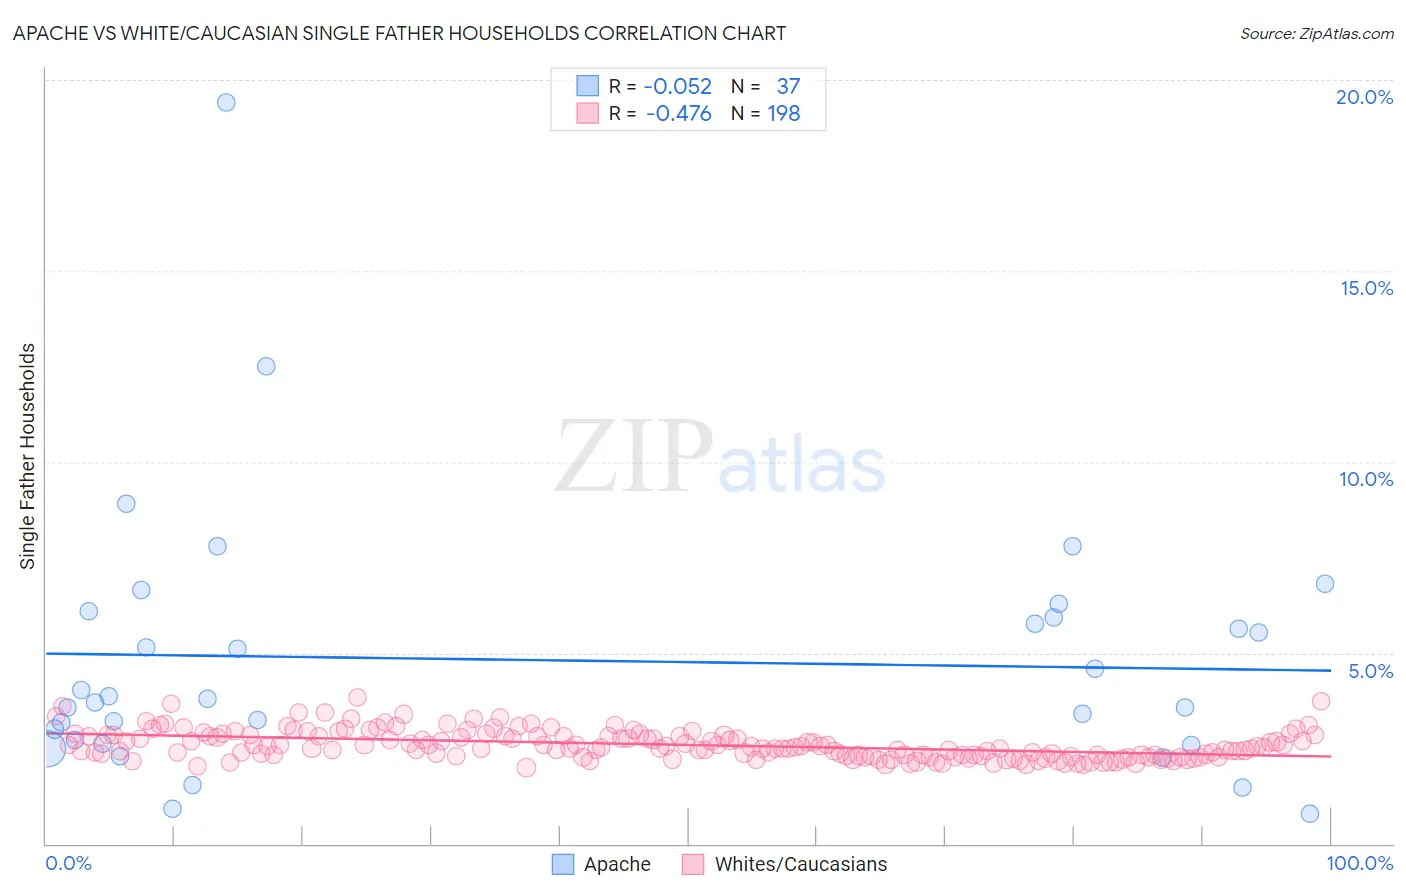
Apache vs White/Caucasian Single Father Households Correlation Chart
The statistical analysis conducted on geographies consisting of 230,074,281 people shows a slight negative correlation between the proportion of Apache and percentage of single father households in the United States with a correlation coefficient (R) of -0.052 and weighted average of 2.8%. Similarly, the statistical analysis conducted on geographies consisting of 565,193,918 people shows a moderate negative correlation between the proportion of Whites/Caucasians and percentage of single father households in the United States with a correlation coefficient (R) of -0.476 and weighted average of 2.4%, a difference of 18.5%.
Single Father Households Correlation Summary
| Measurement | Apache | White/Caucasian |
| Minimum | 0.80% | 2.0% |
| Maximum | 19.4% | 3.8% |
| Range | 18.6% | 1.8% |
| Mean | 4.8% | 2.6% |
| Median | 3.8% | 2.5% |
| Interquartile 25% (IQ1) | 2.7% | 2.3% |
| Interquartile 75% (IQ3) | 6.0% | 2.8% |
| Interquartile Range (IQR) | 3.3% | 0.54% |
| Standard Deviation (Sample) | 3.4% | 0.37% |
| Standard Deviation (Population) | 3.4% | 0.37% |
Similar Demographics by Single Father Households
Demographics Similar to Apache by Single Father Households
In terms of single father households, the demographic groups most similar to Apache are Hopi (2.8%, a difference of 0.18%), Immigrants from the Azores (2.8%, a difference of 0.35%), Hispanic or Latino (2.8%, a difference of 0.50%), Mexican American Indian (2.8%, a difference of 0.66%), and Central American (2.9%, a difference of 0.71%).
| Demographics | Rating | Rank | Single Father Households |
| Immigrants | Latin America | 0.0 /100 | #301 | Tragic 2.8% |
| Spanish Americans | 0.0 /100 | #302 | Tragic 2.8% |
| Immigrants | Honduras | 0.0 /100 | #303 | Tragic 2.8% |
| Mexican American Indians | 0.0 /100 | #304 | Tragic 2.8% |
| Hispanics or Latinos | 0.0 /100 | #305 | Tragic 2.8% |
| Immigrants | Azores | 0.0 /100 | #306 | Tragic 2.8% |
| Hopi | 0.0 /100 | #307 | Tragic 2.8% |
| Apache | 0.0 /100 | #308 | Tragic 2.8% |
| Central Americans | 0.0 /100 | #309 | Tragic 2.9% |
| Immigrants | Laos | 0.0 /100 | #310 | Tragic 2.9% |
| Spanish American Indians | 0.0 /100 | #311 | Tragic 2.9% |
| Tsimshian | 0.0 /100 | #312 | Tragic 2.9% |
| Arapaho | 0.0 /100 | #313 | Tragic 2.9% |
| Salvadorans | 0.0 /100 | #314 | Tragic 2.9% |
| Cheyenne | 0.0 /100 | #315 | Tragic 2.9% |
Demographics Similar to Whites/Caucasians by Single Father Households
In terms of single father households, the demographic groups most similar to Whites/Caucasians are Korean (2.4%, a difference of 0.15%), Immigrants from Afghanistan (2.4%, a difference of 0.16%), Ecuadorian (2.4%, a difference of 0.18%), French Canadian (2.4%, a difference of 0.21%), and Immigrants from Kenya (2.4%, a difference of 0.25%).
| Demographics | Rating | Rank | Single Father Households |
| Peruvians | 27.1 /100 | #200 | Fair 2.4% |
| Immigrants | Uganda | 26.0 /100 | #201 | Fair 2.4% |
| German Russians | 25.7 /100 | #202 | Fair 2.4% |
| French Canadians | 24.7 /100 | #203 | Fair 2.4% |
| Ecuadorians | 24.5 /100 | #204 | Fair 2.4% |
| Immigrants | Afghanistan | 24.2 /100 | #205 | Fair 2.4% |
| Koreans | 24.1 /100 | #206 | Fair 2.4% |
| Whites/Caucasians | 22.6 /100 | #207 | Fair 2.4% |
| Immigrants | Kenya | 20.3 /100 | #208 | Fair 2.4% |
| Immigrants | Peru | 19.3 /100 | #209 | Poor 2.4% |
| Immigrants | Costa Rica | 19.2 /100 | #210 | Poor 2.4% |
| Immigrants | Nigeria | 18.7 /100 | #211 | Poor 2.4% |
| Finns | 18.3 /100 | #212 | Poor 2.4% |
| Norwegians | 17.1 /100 | #213 | Poor 2.4% |
| Ethiopians | 16.6 /100 | #214 | Poor 2.4% |