Apache vs White/Caucasian Unemployment Among Youth under 25 years
COMPARE
Apache
White/Caucasian
Unemployment Among Youth under 25 years
Unemployment Among Youth under 25 years Comparison
Apache
Whites/Caucasians
13.5%
UNEMPLOYMENT AMONG YOUTH UNDER 25 YEARS
0.0/ 100
METRIC RATING
291st/ 347
METRIC RANK
11.2%
UNEMPLOYMENT AMONG YOUTH UNDER 25 YEARS
96.9/ 100
METRIC RATING
77th/ 347
METRIC RANK
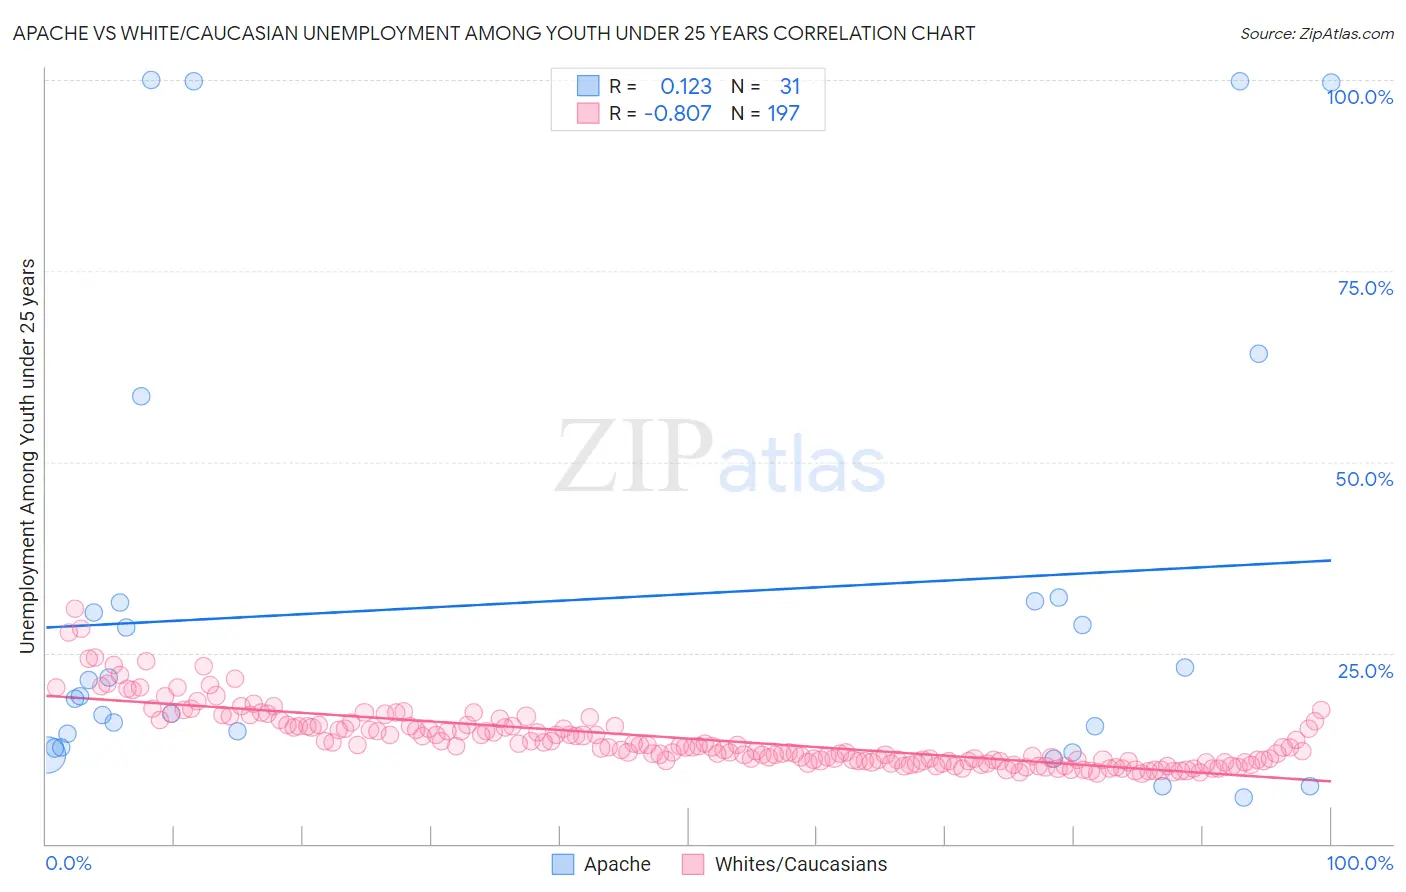
Apache vs White/Caucasian Unemployment Among Youth under 25 years Correlation Chart
The statistical analysis conducted on geographies consisting of 229,139,085 people shows a poor positive correlation between the proportion of Apache and unemployment rate among youth under the age of 25 in the United States with a correlation coefficient (R) of 0.123 and weighted average of 13.5%. Similarly, the statistical analysis conducted on geographies consisting of 555,079,229 people shows a very strong negative correlation between the proportion of Whites/Caucasians and unemployment rate among youth under the age of 25 in the United States with a correlation coefficient (R) of -0.807 and weighted average of 11.2%, a difference of 20.2%.
Unemployment Among Youth under 25 years Correlation Summary
| Measurement | Apache | White/Caucasian |
| Minimum | 6.1% | 9.2% |
| Maximum | 100.0% | 30.8% |
| Range | 93.9% | 21.5% |
| Mean | 31.8% | 13.7% |
| Median | 19.3% | 12.7% |
| Interquartile 25% (IQ1) | 12.6% | 10.8% |
| Interquartile 75% (IQ3) | 31.8% | 15.5% |
| Interquartile Range (IQR) | 19.2% | 4.7% |
| Standard Deviation (Sample) | 29.6% | 4.0% |
| Standard Deviation (Population) | 29.1% | 3.9% |
Similar Demographics by Unemployment Among Youth under 25 years
Demographics Similar to Apache by Unemployment Among Youth under 25 years
In terms of unemployment among youth under 25 years, the demographic groups most similar to Apache are Central American Indian (13.5%, a difference of 0.030%), Spanish American Indian (13.5%, a difference of 0.14%), Immigrants from Ecuador (13.4%, a difference of 0.25%), Immigrants from Caribbean (13.5%, a difference of 0.31%), and Chippewa (13.5%, a difference of 0.54%).
| Demographics | Rating | Rank | Unemployment Among Youth under 25 years |
| Lumbee | 0.0 /100 | #284 | Tragic 13.3% |
| Ghanaians | 0.0 /100 | #285 | Tragic 13.3% |
| Blackfeet | 0.0 /100 | #286 | Tragic 13.3% |
| Ecuadorians | 0.0 /100 | #287 | Tragic 13.3% |
| Immigrants | Western Africa | 0.0 /100 | #288 | Tragic 13.4% |
| Immigrants | Ghana | 0.0 /100 | #289 | Tragic 13.4% |
| Immigrants | Ecuador | 0.0 /100 | #290 | Tragic 13.4% |
| Apache | 0.0 /100 | #291 | Tragic 13.5% |
| Central American Indians | 0.0 /100 | #292 | Tragic 13.5% |
| Spanish American Indians | 0.0 /100 | #293 | Tragic 13.5% |
| Immigrants | Caribbean | 0.0 /100 | #294 | Tragic 13.5% |
| Chippewa | 0.0 /100 | #295 | Tragic 13.5% |
| Senegalese | 0.0 /100 | #296 | Tragic 13.5% |
| U.S. Virgin Islanders | 0.0 /100 | #297 | Tragic 13.6% |
| Shoshone | 0.0 /100 | #298 | Tragic 13.7% |
Demographics Similar to Whites/Caucasians by Unemployment Among Youth under 25 years
In terms of unemployment among youth under 25 years, the demographic groups most similar to Whites/Caucasians are German Russian (11.2%, a difference of 0.050%), Immigrants from Nicaragua (11.2%, a difference of 0.060%), Immigrants from Canada (11.2%, a difference of 0.070%), French (11.2%, a difference of 0.080%), and New Zealander (11.2%, a difference of 0.11%).
| Demographics | Rating | Rank | Unemployment Among Youth under 25 years |
| Slavs | 97.5 /100 | #70 | Exceptional 11.2% |
| Bhutanese | 97.4 /100 | #71 | Exceptional 11.2% |
| Immigrants | Australia | 97.3 /100 | #72 | Exceptional 11.2% |
| Creek | 97.2 /100 | #73 | Exceptional 11.2% |
| New Zealanders | 97.2 /100 | #74 | Exceptional 11.2% |
| French | 97.1 /100 | #75 | Exceptional 11.2% |
| German Russians | 97.0 /100 | #76 | Exceptional 11.2% |
| Whites/Caucasians | 96.9 /100 | #77 | Exceptional 11.2% |
| Immigrants | Nicaragua | 96.7 /100 | #78 | Exceptional 11.2% |
| Immigrants | Canada | 96.7 /100 | #79 | Exceptional 11.2% |
| Immigrants | Bulgaria | 96.4 /100 | #80 | Exceptional 11.2% |
| Icelanders | 96.3 /100 | #81 | Exceptional 11.2% |
| Northern Europeans | 96.2 /100 | #82 | Exceptional 11.2% |
| Bolivians | 96.1 /100 | #83 | Exceptional 11.2% |
| French Canadians | 95.9 /100 | #84 | Exceptional 11.2% |