Somali vs White/Caucasian Single Father Households
COMPARE
Somali
White/Caucasian
Single Father Households
Single Father Households Comparison
Somalis
Whites/Caucasians
2.5%
SINGLE FATHER HOUSEHOLDS
2.1/ 100
METRIC RATING
250th/ 347
METRIC RANK
2.4%
SINGLE FATHER HOUSEHOLDS
22.6/ 100
METRIC RATING
207th/ 347
METRIC RANK
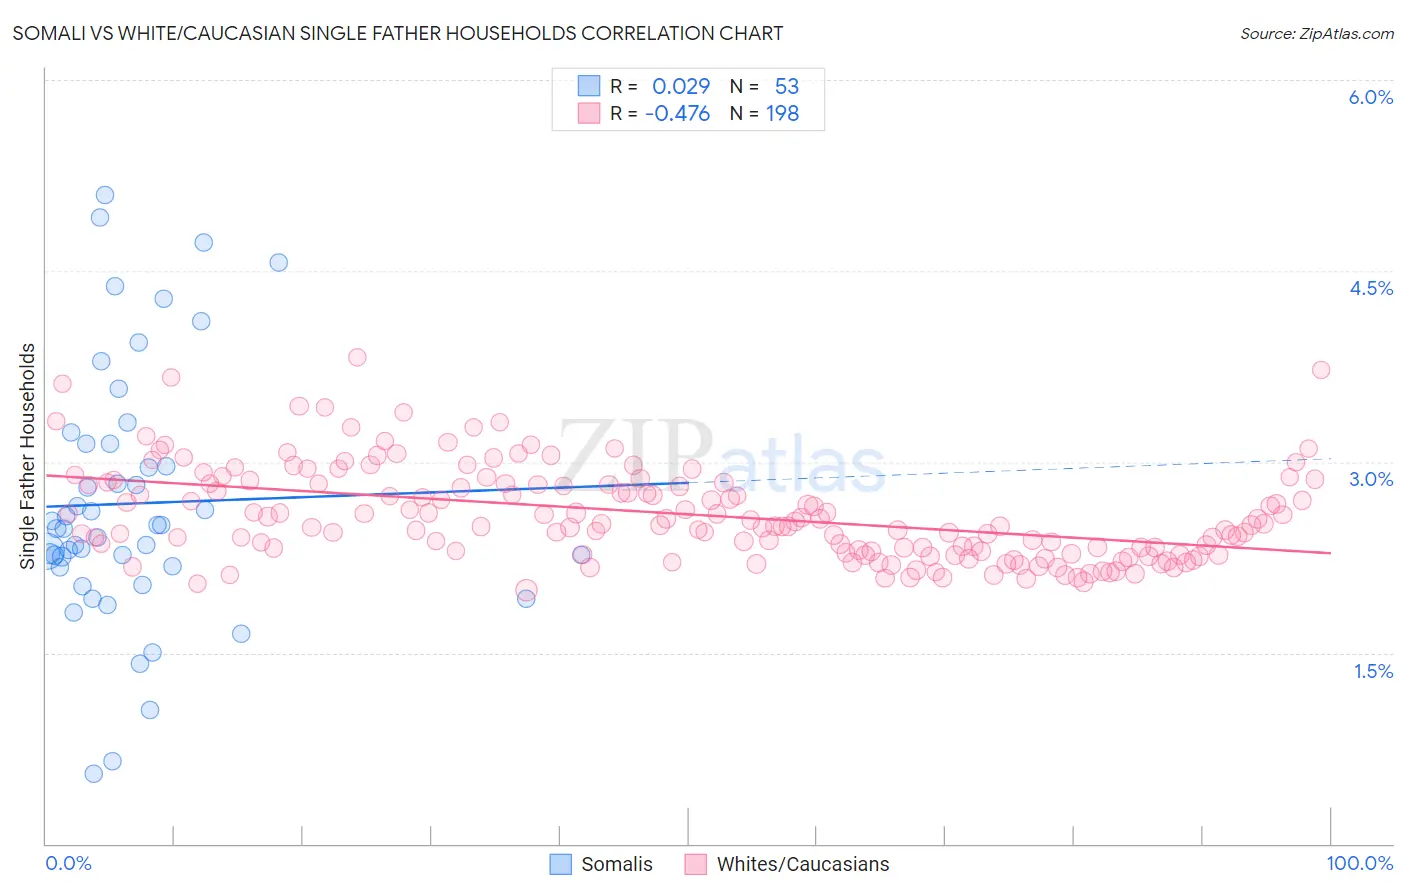
Somali vs White/Caucasian Single Father Households Correlation Chart
The statistical analysis conducted on geographies consisting of 99,117,058 people shows no correlation between the proportion of Somalis and percentage of single father households in the United States with a correlation coefficient (R) of 0.029 and weighted average of 2.5%. Similarly, the statistical analysis conducted on geographies consisting of 565,193,918 people shows a moderate negative correlation between the proportion of Whites/Caucasians and percentage of single father households in the United States with a correlation coefficient (R) of -0.476 and weighted average of 2.4%, a difference of 4.7%.
Single Father Households Correlation Summary
| Measurement | Somali | White/Caucasian |
| Minimum | 0.55% | 2.0% |
| Maximum | 5.1% | 3.8% |
| Range | 4.5% | 1.8% |
| Mean | 2.7% | 2.6% |
| Median | 2.5% | 2.5% |
| Interquartile 25% (IQ1) | 2.2% | 2.3% |
| Interquartile 75% (IQ3) | 3.1% | 2.8% |
| Interquartile Range (IQR) | 0.97% | 0.54% |
| Standard Deviation (Sample) | 1.0% | 0.37% |
| Standard Deviation (Population) | 0.99% | 0.37% |
Similar Demographics by Single Father Households
Demographics Similar to Somalis by Single Father Households
In terms of single father households, the demographic groups most similar to Somalis are Liberian (2.5%, a difference of 0.090%), Immigrants from Eritrea (2.5%, a difference of 0.11%), Immigrants from Cameroon (2.5%, a difference of 0.17%), Immigrants from Somalia (2.5%, a difference of 0.18%), and Immigrants from Thailand (2.5%, a difference of 0.22%).
| Demographics | Rating | Rank | Single Father Households |
| Spaniards | 3.1 /100 | #243 | Tragic 2.5% |
| Immigrants | Middle Africa | 2.8 /100 | #244 | Tragic 2.5% |
| Basques | 2.5 /100 | #245 | Tragic 2.5% |
| Native Hawaiians | 2.5 /100 | #246 | Tragic 2.5% |
| Delaware | 2.5 /100 | #247 | Tragic 2.5% |
| Bahamians | 2.4 /100 | #248 | Tragic 2.5% |
| Immigrants | Cameroon | 2.3 /100 | #249 | Tragic 2.5% |
| Somalis | 2.1 /100 | #250 | Tragic 2.5% |
| Liberians | 2.0 /100 | #251 | Tragic 2.5% |
| Immigrants | Eritrea | 2.0 /100 | #252 | Tragic 2.5% |
| Immigrants | Somalia | 1.9 /100 | #253 | Tragic 2.5% |
| Immigrants | Thailand | 1.8 /100 | #254 | Tragic 2.5% |
| Tongans | 1.5 /100 | #255 | Tragic 2.5% |
| Potawatomi | 1.4 /100 | #256 | Tragic 2.5% |
| Immigrants | Congo | 1.2 /100 | #257 | Tragic 2.5% |
Demographics Similar to Whites/Caucasians by Single Father Households
In terms of single father households, the demographic groups most similar to Whites/Caucasians are Korean (2.4%, a difference of 0.15%), Immigrants from Afghanistan (2.4%, a difference of 0.16%), Ecuadorian (2.4%, a difference of 0.18%), French Canadian (2.4%, a difference of 0.21%), and Immigrants from Kenya (2.4%, a difference of 0.25%).
| Demographics | Rating | Rank | Single Father Households |
| Peruvians | 27.1 /100 | #200 | Fair 2.4% |
| Immigrants | Uganda | 26.0 /100 | #201 | Fair 2.4% |
| German Russians | 25.7 /100 | #202 | Fair 2.4% |
| French Canadians | 24.7 /100 | #203 | Fair 2.4% |
| Ecuadorians | 24.5 /100 | #204 | Fair 2.4% |
| Immigrants | Afghanistan | 24.2 /100 | #205 | Fair 2.4% |
| Koreans | 24.1 /100 | #206 | Fair 2.4% |
| Whites/Caucasians | 22.6 /100 | #207 | Fair 2.4% |
| Immigrants | Kenya | 20.3 /100 | #208 | Fair 2.4% |
| Immigrants | Peru | 19.3 /100 | #209 | Poor 2.4% |
| Immigrants | Costa Rica | 19.2 /100 | #210 | Poor 2.4% |
| Immigrants | Nigeria | 18.7 /100 | #211 | Poor 2.4% |
| Finns | 18.3 /100 | #212 | Poor 2.4% |
| Norwegians | 17.1 /100 | #213 | Poor 2.4% |
| Ethiopians | 16.6 /100 | #214 | Poor 2.4% |