Apache vs Iraqi Single Father Households
COMPARE
Apache
Iraqi
Single Father Households
Single Father Households Comparison
Apache
Iraqis
2.8%
SINGLE FATHER HOUSEHOLDS
0.0/ 100
METRIC RATING
308th/ 347
METRIC RANK
2.2%
SINGLE FATHER HOUSEHOLDS
98.2/ 100
METRIC RATING
113th/ 347
METRIC RANK
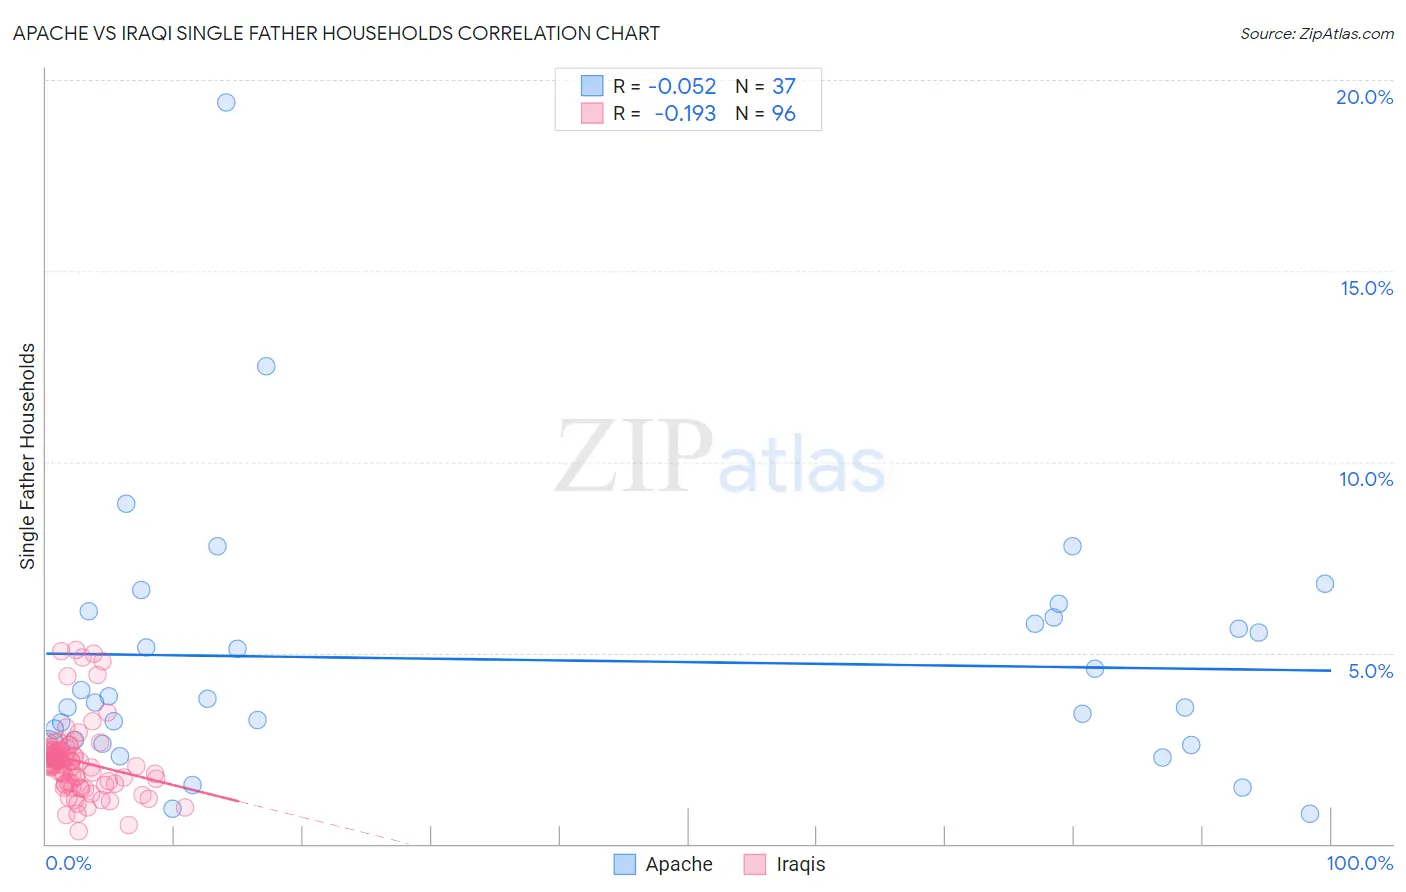
Apache vs Iraqi Single Father Households Correlation Chart
The statistical analysis conducted on geographies consisting of 230,074,281 people shows a slight negative correlation between the proportion of Apache and percentage of single father households in the United States with a correlation coefficient (R) of -0.052 and weighted average of 2.8%. Similarly, the statistical analysis conducted on geographies consisting of 170,092,363 people shows a poor negative correlation between the proportion of Iraqis and percentage of single father households in the United States with a correlation coefficient (R) of -0.193 and weighted average of 2.2%, a difference of 30.9%.
Single Father Households Correlation Summary
| Measurement | Apache | Iraqi |
| Minimum | 0.80% | 0.33% |
| Maximum | 19.4% | 5.1% |
| Range | 18.6% | 4.7% |
| Mean | 4.8% | 2.2% |
| Median | 3.8% | 2.2% |
| Interquartile 25% (IQ1) | 2.7% | 1.6% |
| Interquartile 75% (IQ3) | 6.0% | 2.4% |
| Interquartile Range (IQR) | 3.3% | 0.81% |
| Standard Deviation (Sample) | 3.4% | 0.93% |
| Standard Deviation (Population) | 3.4% | 0.93% |
Similar Demographics by Single Father Households
Demographics Similar to Apache by Single Father Households
In terms of single father households, the demographic groups most similar to Apache are Hopi (2.8%, a difference of 0.18%), Immigrants from the Azores (2.8%, a difference of 0.35%), Hispanic or Latino (2.8%, a difference of 0.50%), Mexican American Indian (2.8%, a difference of 0.66%), and Central American (2.9%, a difference of 0.71%).
| Demographics | Rating | Rank | Single Father Households |
| Immigrants | Latin America | 0.0 /100 | #301 | Tragic 2.8% |
| Spanish Americans | 0.0 /100 | #302 | Tragic 2.8% |
| Immigrants | Honduras | 0.0 /100 | #303 | Tragic 2.8% |
| Mexican American Indians | 0.0 /100 | #304 | Tragic 2.8% |
| Hispanics or Latinos | 0.0 /100 | #305 | Tragic 2.8% |
| Immigrants | Azores | 0.0 /100 | #306 | Tragic 2.8% |
| Hopi | 0.0 /100 | #307 | Tragic 2.8% |
| Apache | 0.0 /100 | #308 | Tragic 2.8% |
| Central Americans | 0.0 /100 | #309 | Tragic 2.9% |
| Immigrants | Laos | 0.0 /100 | #310 | Tragic 2.9% |
| Spanish American Indians | 0.0 /100 | #311 | Tragic 2.9% |
| Tsimshian | 0.0 /100 | #312 | Tragic 2.9% |
| Arapaho | 0.0 /100 | #313 | Tragic 2.9% |
| Salvadorans | 0.0 /100 | #314 | Tragic 2.9% |
| Cheyenne | 0.0 /100 | #315 | Tragic 2.9% |
Demographics Similar to Iraqis by Single Father Households
In terms of single father households, the demographic groups most similar to Iraqis are Immigrants from Trinidad and Tobago (2.2%, a difference of 0.010%), Immigrants from North America (2.2%, a difference of 0.040%), Immigrants from Canada (2.2%, a difference of 0.050%), Immigrants from Barbados (2.2%, a difference of 0.070%), and Immigrants from Argentina (2.2%, a difference of 0.10%).
| Demographics | Rating | Rank | Single Father Households |
| Immigrants | Southern Europe | 98.6 /100 | #106 | Exceptional 2.2% |
| Slovenes | 98.5 /100 | #107 | Exceptional 2.2% |
| Immigrants | Netherlands | 98.5 /100 | #108 | Exceptional 2.2% |
| Barbadians | 98.4 /100 | #109 | Exceptional 2.2% |
| Italians | 98.3 /100 | #110 | Exceptional 2.2% |
| Immigrants | Canada | 98.3 /100 | #111 | Exceptional 2.2% |
| Immigrants | Trinidad and Tobago | 98.2 /100 | #112 | Exceptional 2.2% |
| Iraqis | 98.2 /100 | #113 | Exceptional 2.2% |
| Immigrants | North America | 98.2 /100 | #114 | Exceptional 2.2% |
| Immigrants | Barbados | 98.2 /100 | #115 | Exceptional 2.2% |
| Immigrants | Argentina | 98.1 /100 | #116 | Exceptional 2.2% |
| Hungarians | 97.9 /100 | #117 | Exceptional 2.2% |
| Immigrants | Morocco | 97.8 /100 | #118 | Exceptional 2.2% |
| Trinidadians and Tobagonians | 97.8 /100 | #119 | Exceptional 2.2% |
| Australians | 97.7 /100 | #120 | Exceptional 2.2% |