Immigrants from Panama vs White/Caucasian Single Father Households
COMPARE
Immigrants from Panama
White/Caucasian
Single Father Households
Single Father Households Comparison
Immigrants from Panama
Whites/Caucasians
2.4%
SINGLE FATHER HOUSEHOLDS
41.8/ 100
METRIC RATING
183rd/ 347
METRIC RANK
2.4%
SINGLE FATHER HOUSEHOLDS
22.6/ 100
METRIC RATING
207th/ 347
METRIC RANK
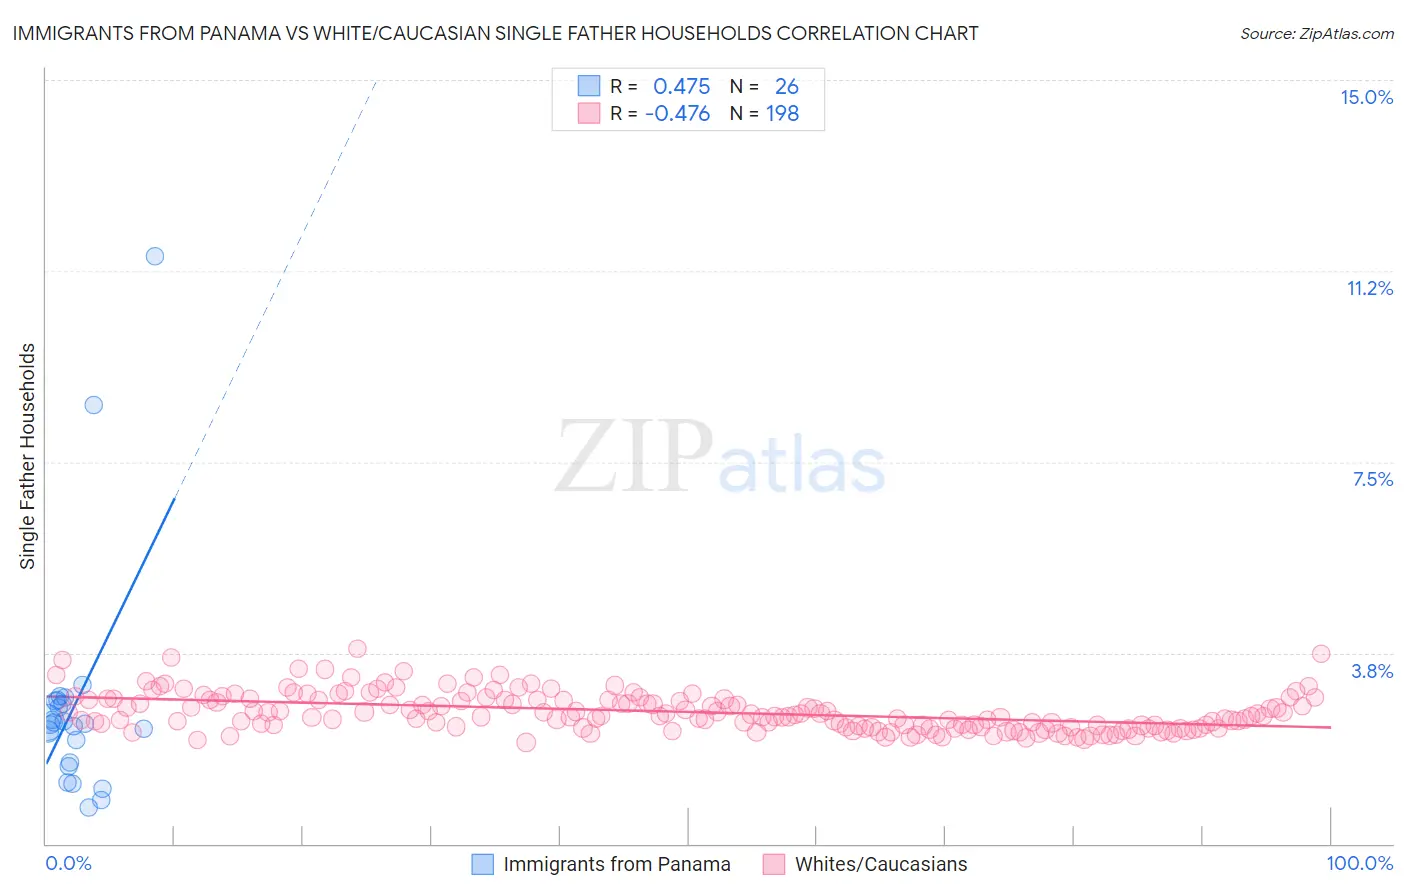
Immigrants from Panama vs White/Caucasian Single Father Households Correlation Chart
The statistical analysis conducted on geographies consisting of 220,623,122 people shows a moderate positive correlation between the proportion of Immigrants from Panama and percentage of single father households in the United States with a correlation coefficient (R) of 0.475 and weighted average of 2.4%. Similarly, the statistical analysis conducted on geographies consisting of 565,193,918 people shows a moderate negative correlation between the proportion of Whites/Caucasians and percentage of single father households in the United States with a correlation coefficient (R) of -0.476 and weighted average of 2.4%, a difference of 1.6%.
Single Father Households Correlation Summary
| Measurement | Immigrants from Panama | White/Caucasian |
| Minimum | 0.72% | 2.0% |
| Maximum | 11.5% | 3.8% |
| Range | 10.8% | 1.8% |
| Mean | 2.7% | 2.6% |
| Median | 2.4% | 2.5% |
| Interquartile 25% (IQ1) | 1.6% | 2.3% |
| Interquartile 75% (IQ3) | 2.8% | 2.8% |
| Interquartile Range (IQR) | 1.2% | 0.54% |
| Standard Deviation (Sample) | 2.3% | 0.37% |
| Standard Deviation (Population) | 2.3% | 0.37% |
Similar Demographics by Single Father Households
Demographics Similar to Immigrants from Panama by Single Father Households
In terms of single father households, the demographic groups most similar to Immigrants from Panama are Sri Lankan (2.4%, a difference of 0.0%), Nigerian (2.4%, a difference of 0.060%), Belgian (2.3%, a difference of 0.11%), Immigrants from Bosnia and Herzegovina (2.4%, a difference of 0.11%), and Jamaican (2.3%, a difference of 0.12%).
| Demographics | Rating | Rank | Single Father Households |
| Danes | 48.2 /100 | #176 | Average 2.3% |
| Colombians | 48.0 /100 | #177 | Average 2.3% |
| Costa Ricans | 44.1 /100 | #178 | Average 2.3% |
| Welsh | 44.0 /100 | #179 | Average 2.3% |
| Yugoslavians | 43.9 /100 | #180 | Average 2.3% |
| Jamaicans | 43.5 /100 | #181 | Average 2.3% |
| Belgians | 43.3 /100 | #182 | Average 2.3% |
| Immigrants | Panama | 41.8 /100 | #183 | Average 2.4% |
| Sri Lankans | 41.8 /100 | #184 | Average 2.4% |
| Nigerians | 41.0 /100 | #185 | Average 2.4% |
| Immigrants | Bosnia and Herzegovina | 40.4 /100 | #186 | Average 2.4% |
| Immigrants | Colombia | 34.0 /100 | #187 | Fair 2.4% |
| Hmong | 33.0 /100 | #188 | Fair 2.4% |
| U.S. Virgin Islanders | 31.8 /100 | #189 | Fair 2.4% |
| French | 31.7 /100 | #190 | Fair 2.4% |
Demographics Similar to Whites/Caucasians by Single Father Households
In terms of single father households, the demographic groups most similar to Whites/Caucasians are Korean (2.4%, a difference of 0.15%), Immigrants from Afghanistan (2.4%, a difference of 0.16%), Ecuadorian (2.4%, a difference of 0.18%), French Canadian (2.4%, a difference of 0.21%), and Immigrants from Kenya (2.4%, a difference of 0.25%).
| Demographics | Rating | Rank | Single Father Households |
| Peruvians | 27.1 /100 | #200 | Fair 2.4% |
| Immigrants | Uganda | 26.0 /100 | #201 | Fair 2.4% |
| German Russians | 25.7 /100 | #202 | Fair 2.4% |
| French Canadians | 24.7 /100 | #203 | Fair 2.4% |
| Ecuadorians | 24.5 /100 | #204 | Fair 2.4% |
| Immigrants | Afghanistan | 24.2 /100 | #205 | Fair 2.4% |
| Koreans | 24.1 /100 | #206 | Fair 2.4% |
| Whites/Caucasians | 22.6 /100 | #207 | Fair 2.4% |
| Immigrants | Kenya | 20.3 /100 | #208 | Fair 2.4% |
| Immigrants | Peru | 19.3 /100 | #209 | Poor 2.4% |
| Immigrants | Costa Rica | 19.2 /100 | #210 | Poor 2.4% |
| Immigrants | Nigeria | 18.7 /100 | #211 | Poor 2.4% |
| Finns | 18.3 /100 | #212 | Poor 2.4% |
| Norwegians | 17.1 /100 | #213 | Poor 2.4% |
| Ethiopians | 16.6 /100 | #214 | Poor 2.4% |