Apache vs White/Caucasian Child Poverty Among Boys Under 16
COMPARE
Apache
White/Caucasian
Child Poverty Among Boys Under 16
Child Poverty Among Boys Under 16 Comparison
Apache
Whites/Caucasians
24.5%
CHILD POVERTY AMONG BOYS UNDER 16
0.0/ 100
METRIC RATING
333rd/ 347
METRIC RANK
16.5%
CHILD POVERTY AMONG BOYS UNDER 16
48.2/ 100
METRIC RATING
176th/ 347
METRIC RANK
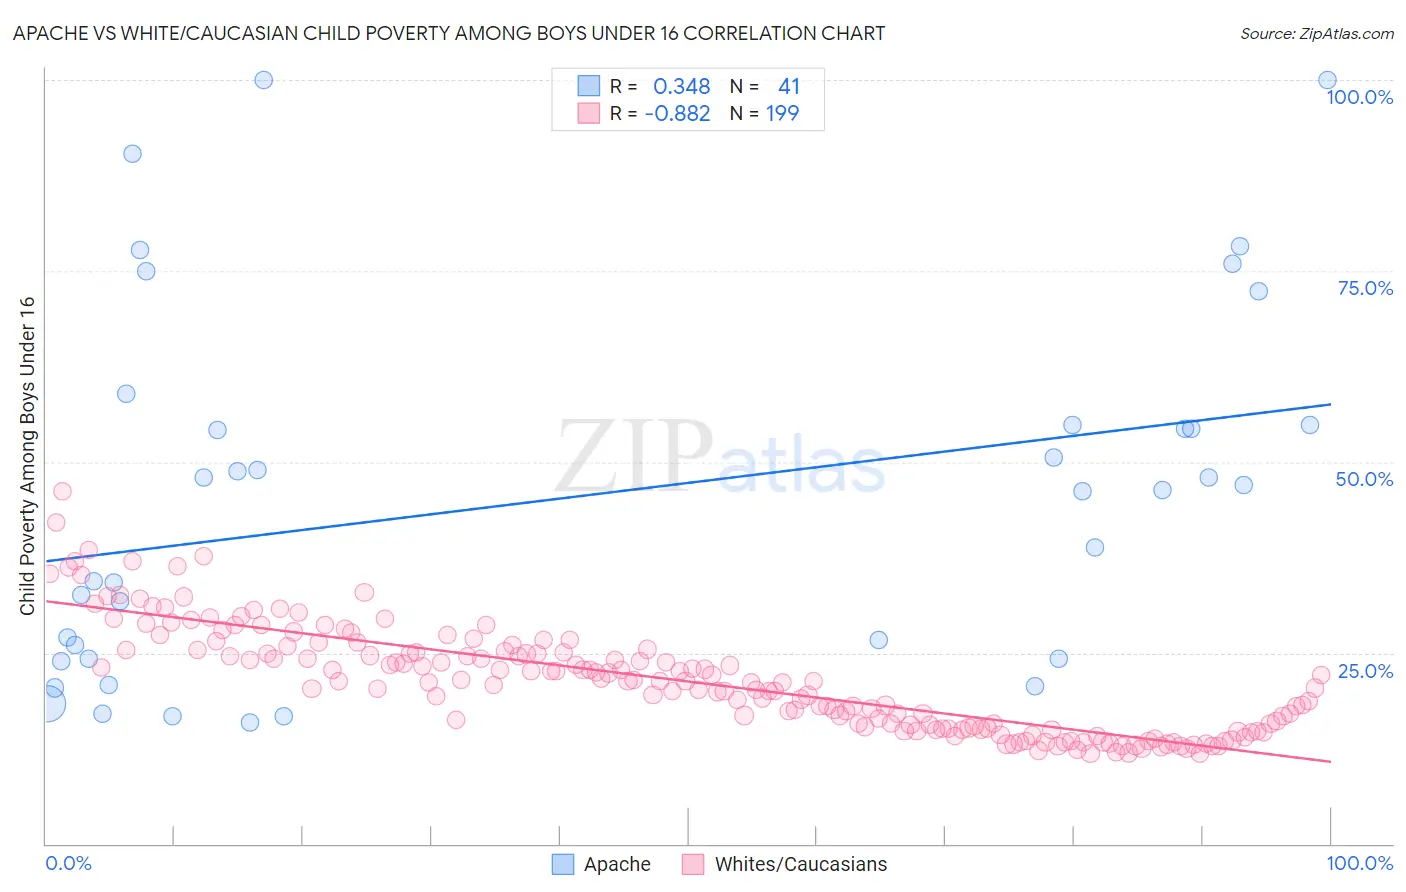
Apache vs White/Caucasian Child Poverty Among Boys Under 16 Correlation Chart
The statistical analysis conducted on geographies consisting of 229,742,001 people shows a mild positive correlation between the proportion of Apache and poverty level among boys under the age of 16 in the United States with a correlation coefficient (R) of 0.348 and weighted average of 24.5%. Similarly, the statistical analysis conducted on geographies consisting of 560,435,427 people shows a very strong negative correlation between the proportion of Whites/Caucasians and poverty level among boys under the age of 16 in the United States with a correlation coefficient (R) of -0.882 and weighted average of 16.5%, a difference of 48.8%.
Child Poverty Among Boys Under 16 Correlation Summary
| Measurement | Apache | White/Caucasian |
| Minimum | 15.9% | 11.8% |
| Maximum | 100.0% | 46.2% |
| Range | 84.1% | 34.4% |
| Mean | 45.2% | 21.3% |
| Median | 46.3% | 21.2% |
| Interquartile 25% (IQ1) | 24.3% | 15.1% |
| Interquartile 75% (IQ3) | 54.8% | 25.3% |
| Interquartile Range (IQR) | 30.6% | 10.2% |
| Standard Deviation (Sample) | 23.6% | 6.9% |
| Standard Deviation (Population) | 23.3% | 6.9% |
Similar Demographics by Child Poverty Among Boys Under 16
Demographics Similar to Apache by Child Poverty Among Boys Under 16
In terms of child poverty among boys under 16, the demographic groups most similar to Apache are Black/African American (24.5%, a difference of 0.12%), Immigrants from Dominican Republic (24.3%, a difference of 0.72%), Yup'ik (24.7%, a difference of 0.97%), Dominican (24.2%, a difference of 1.3%), and Colville (24.1%, a difference of 1.7%).
| Demographics | Rating | Rank | Child Poverty Among Boys Under 16 |
| Paiute | 0.0 /100 | #326 | Tragic 22.8% |
| Immigrants | Honduras | 0.0 /100 | #327 | Tragic 22.8% |
| Pueblo | 0.0 /100 | #328 | Tragic 23.5% |
| Natives/Alaskans | 0.0 /100 | #329 | Tragic 24.0% |
| Colville | 0.0 /100 | #330 | Tragic 24.1% |
| Dominicans | 0.0 /100 | #331 | Tragic 24.2% |
| Immigrants | Dominican Republic | 0.0 /100 | #332 | Tragic 24.3% |
| Apache | 0.0 /100 | #333 | Tragic 24.5% |
| Blacks/African Americans | 0.0 /100 | #334 | Tragic 24.5% |
| Yup'ik | 0.0 /100 | #335 | Tragic 24.7% |
| Sioux | 0.0 /100 | #336 | Tragic 25.3% |
| Cheyenne | 0.0 /100 | #337 | Tragic 25.8% |
| Hopi | 0.0 /100 | #338 | Tragic 25.9% |
| Houma | 0.0 /100 | #339 | Tragic 26.2% |
| Crow | 0.0 /100 | #340 | Tragic 26.3% |
Demographics Similar to Whites/Caucasians by Child Poverty Among Boys Under 16
In terms of child poverty among boys under 16, the demographic groups most similar to Whites/Caucasians are Ethiopian (16.5%, a difference of 0.040%), Scotch-Irish (16.5%, a difference of 0.080%), Immigrants from Syria (16.5%, a difference of 0.090%), Hungarian (16.5%, a difference of 0.10%), and Uruguayan (16.4%, a difference of 0.20%).
| Demographics | Rating | Rank | Child Poverty Among Boys Under 16 |
| Immigrants | Saudi Arabia | 53.6 /100 | #169 | Average 16.4% |
| Immigrants | Bosnia and Herzegovina | 51.7 /100 | #170 | Average 16.4% |
| Immigrants | Ethiopia | 51.3 /100 | #171 | Average 16.4% |
| Immigrants | Colombia | 50.8 /100 | #172 | Average 16.4% |
| Tsimshian | 50.5 /100 | #173 | Average 16.4% |
| Uruguayans | 50.0 /100 | #174 | Average 16.4% |
| Immigrants | Syria | 49.0 /100 | #175 | Average 16.5% |
| Whites/Caucasians | 48.2 /100 | #176 | Average 16.5% |
| Ethiopians | 47.8 /100 | #177 | Average 16.5% |
| Scotch-Irish | 47.5 /100 | #178 | Average 16.5% |
| Hungarians | 47.3 /100 | #179 | Average 16.5% |
| Hawaiians | 45.5 /100 | #180 | Average 16.5% |
| South American Indians | 44.3 /100 | #181 | Average 16.5% |
| Lebanese | 43.3 /100 | #182 | Average 16.6% |
| Kenyans | 41.0 /100 | #183 | Average 16.6% |