Senegalese vs Immigrants from Greece Single Father Households
COMPARE
Senegalese
Immigrants from Greece
Single Father Households
Single Father Households Comparison
Senegalese
Immigrants from Greece
2.3%
SINGLE FATHER HOUSEHOLDS
88.4/ 100
METRIC RATING
149th/ 347
METRIC RANK
1.9%
SINGLE FATHER HOUSEHOLDS
100.0/ 100
METRIC RATING
12th/ 347
METRIC RANK
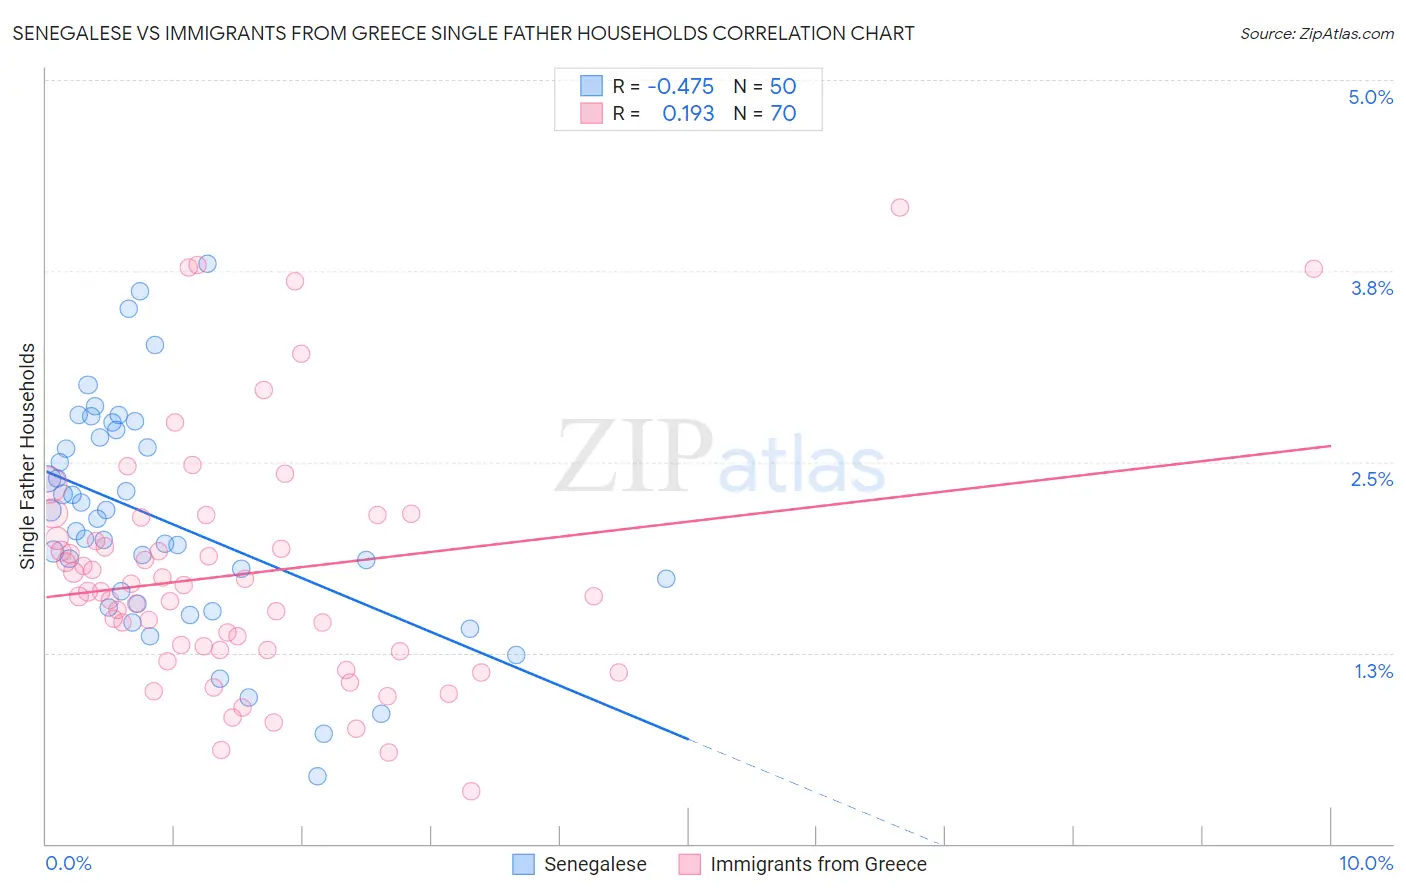
Senegalese vs Immigrants from Greece Single Father Households Correlation Chart
The statistical analysis conducted on geographies consisting of 77,943,775 people shows a moderate negative correlation between the proportion of Senegalese and percentage of single father households in the United States with a correlation coefficient (R) of -0.475 and weighted average of 2.3%. Similarly, the statistical analysis conducted on geographies consisting of 215,474,728 people shows a poor positive correlation between the proportion of Immigrants from Greece and percentage of single father households in the United States with a correlation coefficient (R) of 0.193 and weighted average of 1.9%, a difference of 20.6%.
Single Father Households Correlation Summary
| Measurement | Senegalese | Immigrants from Greece |
| Minimum | 0.44% | 0.34% |
| Maximum | 3.8% | 4.2% |
| Range | 3.4% | 3.8% |
| Mean | 2.1% | 1.8% |
| Median | 2.1% | 1.7% |
| Interquartile 25% (IQ1) | 1.6% | 1.3% |
| Interquartile 75% (IQ3) | 2.7% | 2.0% |
| Interquartile Range (IQR) | 1.1% | 0.73% |
| Standard Deviation (Sample) | 0.74% | 0.80% |
| Standard Deviation (Population) | 0.73% | 0.79% |
Similar Demographics by Single Father Households
Demographics Similar to Senegalese by Single Father Households
In terms of single father households, the demographic groups most similar to Senegalese are South American Indian (2.3%, a difference of 0.010%), Slavic (2.2%, a difference of 0.10%), Northern European (2.2%, a difference of 0.28%), Immigrants from Zimbabwe (2.2%, a difference of 0.36%), and Venezuelan (2.3%, a difference of 0.38%).
| Demographics | Rating | Rank | Single Father Households |
| Luxembourgers | 92.3 /100 | #142 | Exceptional 2.2% |
| Immigrants | Nepal | 92.1 /100 | #143 | Exceptional 2.2% |
| Slovaks | 90.7 /100 | #144 | Exceptional 2.2% |
| Immigrants | Zimbabwe | 90.2 /100 | #145 | Exceptional 2.2% |
| Northern Europeans | 89.8 /100 | #146 | Excellent 2.2% |
| Slavs | 88.9 /100 | #147 | Excellent 2.2% |
| South American Indians | 88.5 /100 | #148 | Excellent 2.3% |
| Senegalese | 88.4 /100 | #149 | Excellent 2.3% |
| Venezuelans | 86.2 /100 | #150 | Excellent 2.3% |
| Immigrants | Syria | 84.8 /100 | #151 | Excellent 2.3% |
| Immigrants | Venezuela | 83.2 /100 | #152 | Excellent 2.3% |
| Immigrants | Germany | 82.8 /100 | #153 | Excellent 2.3% |
| Bolivians | 81.0 /100 | #154 | Excellent 2.3% |
| Europeans | 80.9 /100 | #155 | Excellent 2.3% |
| Immigrants | South America | 79.9 /100 | #156 | Good 2.3% |
Demographics Similar to Immigrants from Greece by Single Father Households
In terms of single father households, the demographic groups most similar to Immigrants from Greece are Immigrants from Singapore (1.9%, a difference of 0.030%), Immigrants from Belarus (1.9%, a difference of 0.44%), Okinawan (1.9%, a difference of 0.76%), Immigrants from Lithuania (1.9%, a difference of 1.0%), and Immigrants from China (1.8%, a difference of 1.1%).
| Demographics | Rating | Rank | Single Father Households |
| Immigrants | Hong Kong | 100.0 /100 | #5 | Exceptional 1.8% |
| Immigrants | Taiwan | 100.0 /100 | #6 | Exceptional 1.8% |
| Cypriots | 100.0 /100 | #7 | Exceptional 1.8% |
| Immigrants | Ireland | 100.0 /100 | #8 | Exceptional 1.8% |
| Immigrants | China | 100.0 /100 | #9 | Exceptional 1.8% |
| Okinawans | 100.0 /100 | #10 | Exceptional 1.9% |
| Immigrants | Belarus | 100.0 /100 | #11 | Exceptional 1.9% |
| Immigrants | Greece | 100.0 /100 | #12 | Exceptional 1.9% |
| Immigrants | Singapore | 100.0 /100 | #13 | Exceptional 1.9% |
| Immigrants | Lithuania | 100.0 /100 | #14 | Exceptional 1.9% |
| Immigrants | Eastern Asia | 100.0 /100 | #15 | Exceptional 1.9% |
| Immigrants | Iran | 100.0 /100 | #16 | Exceptional 1.9% |
| Immigrants | India | 100.0 /100 | #17 | Exceptional 1.9% |
| Indians (Asian) | 100.0 /100 | #18 | Exceptional 1.9% |
| Iranians | 100.0 /100 | #19 | Exceptional 1.9% |