Alsatian vs Immigrants from Colombia Unemployment
COMPARE
Alsatian
Immigrants from Colombia
Unemployment
Unemployment Comparison
Alsatians
Immigrants from Colombia
5.3%
UNEMPLOYMENT
37.0/ 100
METRIC RATING
188th/ 347
METRIC RANK
5.2%
UNEMPLOYMENT
64.7/ 100
METRIC RATING
164th/ 347
METRIC RANK
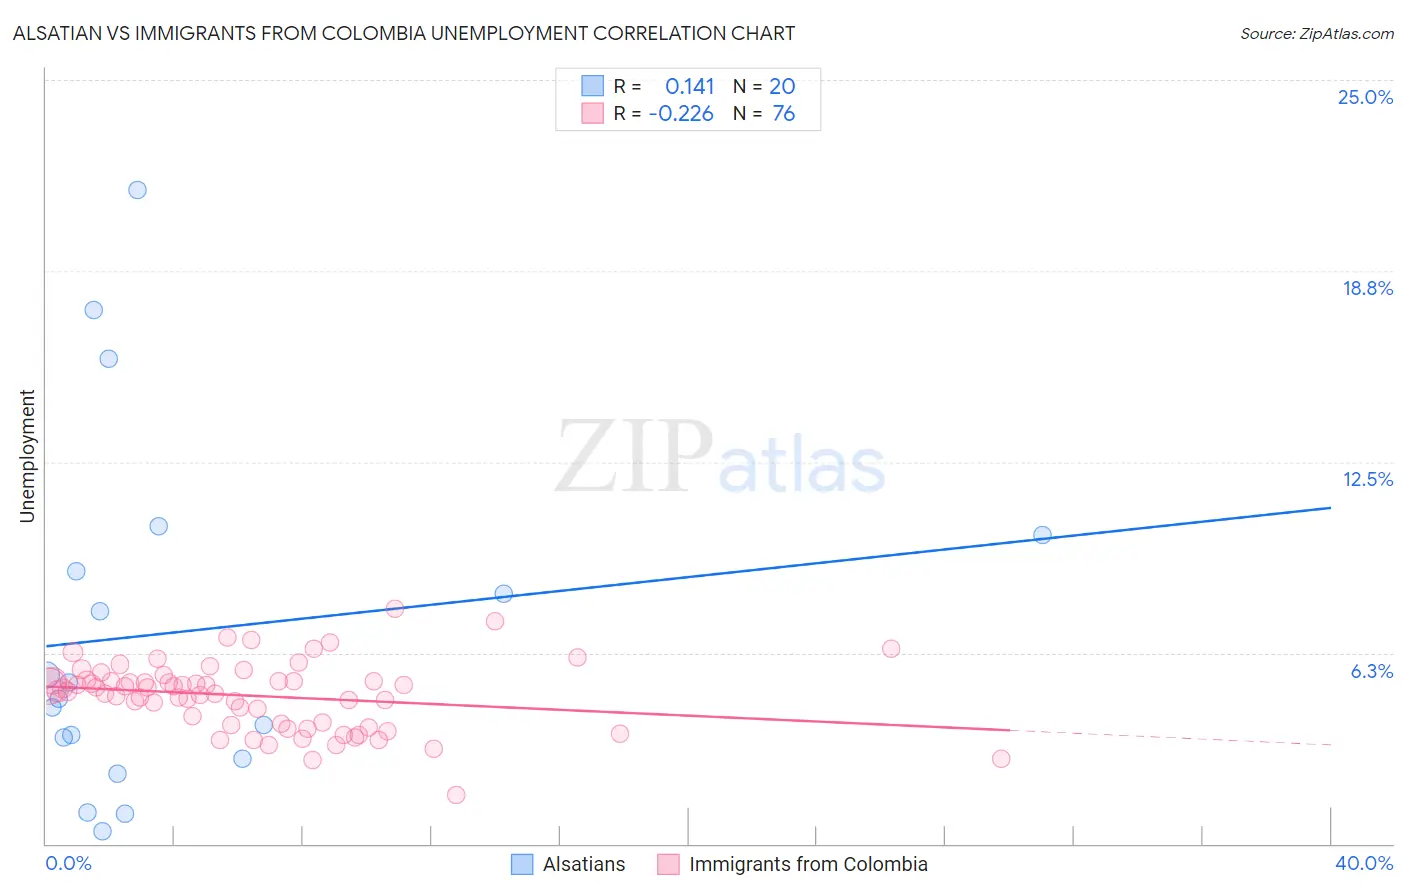
Alsatian vs Immigrants from Colombia Unemployment Correlation Chart
The statistical analysis conducted on geographies consisting of 82,657,373 people shows a poor positive correlation between the proportion of Alsatians and unemployment in the United States with a correlation coefficient (R) of 0.141 and weighted average of 5.3%. Similarly, the statistical analysis conducted on geographies consisting of 378,436,728 people shows a weak negative correlation between the proportion of Immigrants from Colombia and unemployment in the United States with a correlation coefficient (R) of -0.226 and weighted average of 5.2%, a difference of 1.8%.
Unemployment Correlation Summary
| Measurement | Alsatian | Immigrants from Colombia |
| Minimum | 0.40% | 1.6% |
| Maximum | 21.4% | 7.7% |
| Range | 21.0% | 6.1% |
| Mean | 6.9% | 4.8% |
| Median | 5.0% | 5.0% |
| Interquartile 25% (IQ1) | 3.1% | 3.9% |
| Interquartile 75% (IQ3) | 9.5% | 5.3% |
| Interquartile Range (IQR) | 6.4% | 1.4% |
| Standard Deviation (Sample) | 5.7% | 1.1% |
| Standard Deviation (Population) | 5.6% | 1.1% |
Similar Demographics by Unemployment
Demographics Similar to Alsatians by Unemployment
In terms of unemployment, the demographic groups most similar to Alsatians are Costa Rican (5.3%, a difference of 0.020%), Immigrants from Uganda (5.3%, a difference of 0.050%), Immigrants from Belarus (5.3%, a difference of 0.090%), Arab (5.3%, a difference of 0.11%), and Immigrants from Thailand (5.3%, a difference of 0.12%).
| Demographics | Rating | Rank | Unemployment |
| Albanians | 43.5 /100 | #181 | Average 5.3% |
| Spaniards | 42.2 /100 | #182 | Average 5.3% |
| Brazilians | 40.2 /100 | #183 | Average 5.3% |
| Assyrians/Chaldeans/Syriacs | 39.2 /100 | #184 | Fair 5.3% |
| Immigrants | Thailand | 38.9 /100 | #185 | Fair 5.3% |
| Immigrants | Uganda | 37.8 /100 | #186 | Fair 5.3% |
| Costa Ricans | 37.4 /100 | #187 | Fair 5.3% |
| Alsatians | 37.0 /100 | #188 | Fair 5.3% |
| Immigrants | Belarus | 35.6 /100 | #189 | Fair 5.3% |
| Arabs | 35.3 /100 | #190 | Fair 5.3% |
| Somalis | 34.0 /100 | #191 | Fair 5.3% |
| South Americans | 33.9 /100 | #192 | Fair 5.3% |
| Immigrants | Somalia | 33.8 /100 | #193 | Fair 5.3% |
| Immigrants | Laos | 30.9 /100 | #194 | Fair 5.3% |
| Immigrants | Southern Europe | 30.9 /100 | #195 | Fair 5.3% |
Demographics Similar to Immigrants from Colombia by Unemployment
In terms of unemployment, the demographic groups most similar to Immigrants from Colombia are Immigrants from Zaire (5.2%, a difference of 0.0%), Spanish (5.2%, a difference of 0.030%), Immigrants from Oceania (5.2%, a difference of 0.040%), Laotian (5.2%, a difference of 0.11%), and Immigrants from Brazil (5.2%, a difference of 0.11%).
| Demographics | Rating | Rank | Unemployment |
| Sri Lankans | 69.5 /100 | #157 | Good 5.2% |
| Immigrants | Egypt | 66.7 /100 | #158 | Good 5.2% |
| Immigrants | Russia | 66.6 /100 | #159 | Good 5.2% |
| Laotians | 66.3 /100 | #160 | Good 5.2% |
| Immigrants | Oceania | 65.2 /100 | #161 | Good 5.2% |
| Spanish | 65.1 /100 | #162 | Good 5.2% |
| Immigrants | Zaire | 64.7 /100 | #163 | Good 5.2% |
| Immigrants | Colombia | 64.7 /100 | #164 | Good 5.2% |
| Immigrants | Brazil | 63.1 /100 | #165 | Good 5.2% |
| Immigrants | Indonesia | 61.2 /100 | #166 | Good 5.2% |
| Colombians | 61.1 /100 | #167 | Good 5.2% |
| Uruguayans | 60.2 /100 | #168 | Good 5.2% |
| Immigrants | Morocco | 59.1 /100 | #169 | Average 5.2% |
| Immigrants | Nicaragua | 57.1 /100 | #170 | Average 5.2% |
| Puget Sound Salish | 56.6 /100 | #171 | Average 5.2% |